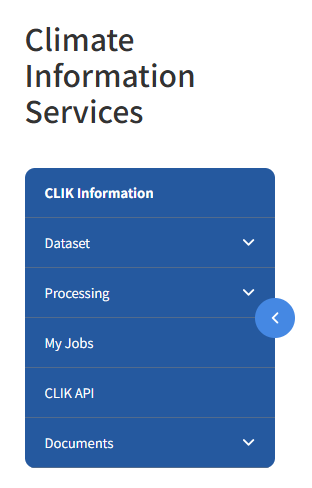
Climate Information Services
- Accessing CLIK
- Sign up for CLIK
- Login into CLIK
- Downloading APCC Multi-Model Ensemble (MME) 3-Month Data
- Downloading Individual Model Data
- Seasonal Prediction (Deterministic Prediction - DMME) Tutorial
- Verification Tutorial
- Prediction Information Downscaling Tutorial
- Data Extraction (Clipping) Tutorial
I. Easy Guide to CLIK
Accessing CLIK
You can access APCC climate prediction information by visiting the CLIK website (https://apcc21.org/clik) in any web browser, such as Chrome or Edge.
(Figure 1-1-1) CLIK Homepage
I. Easy Guide to CLIK
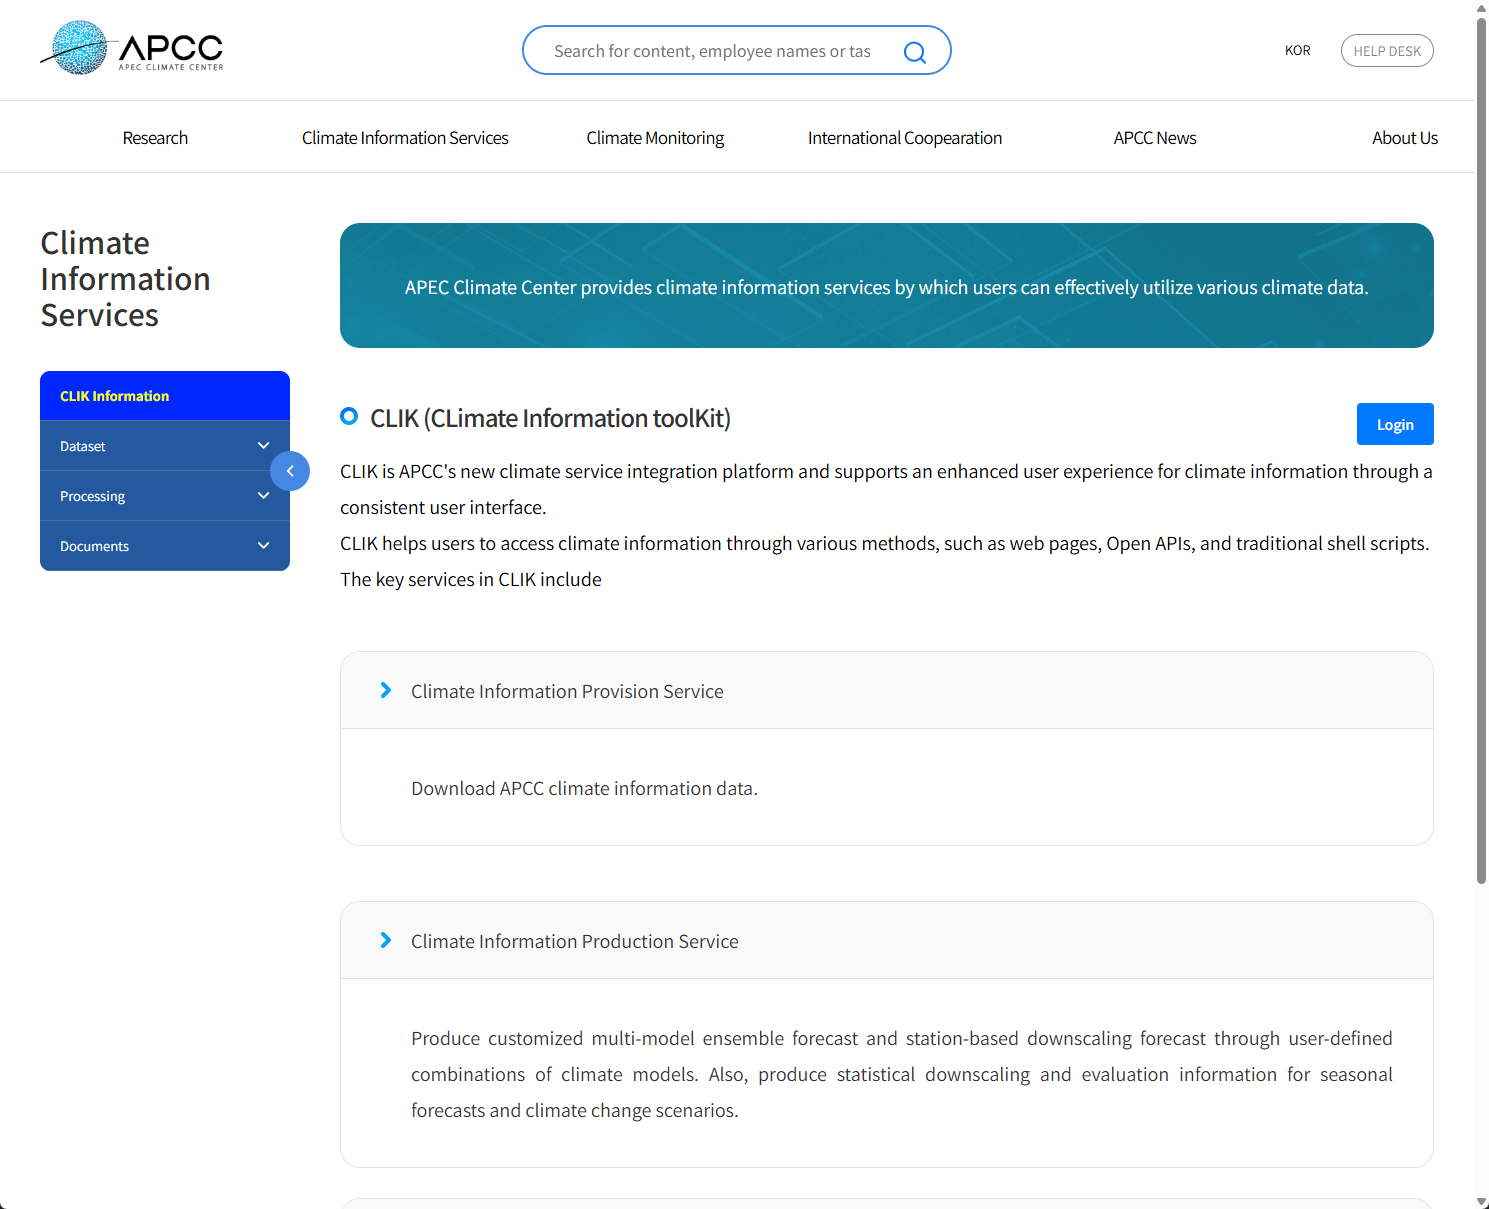
Sign up for CLIK
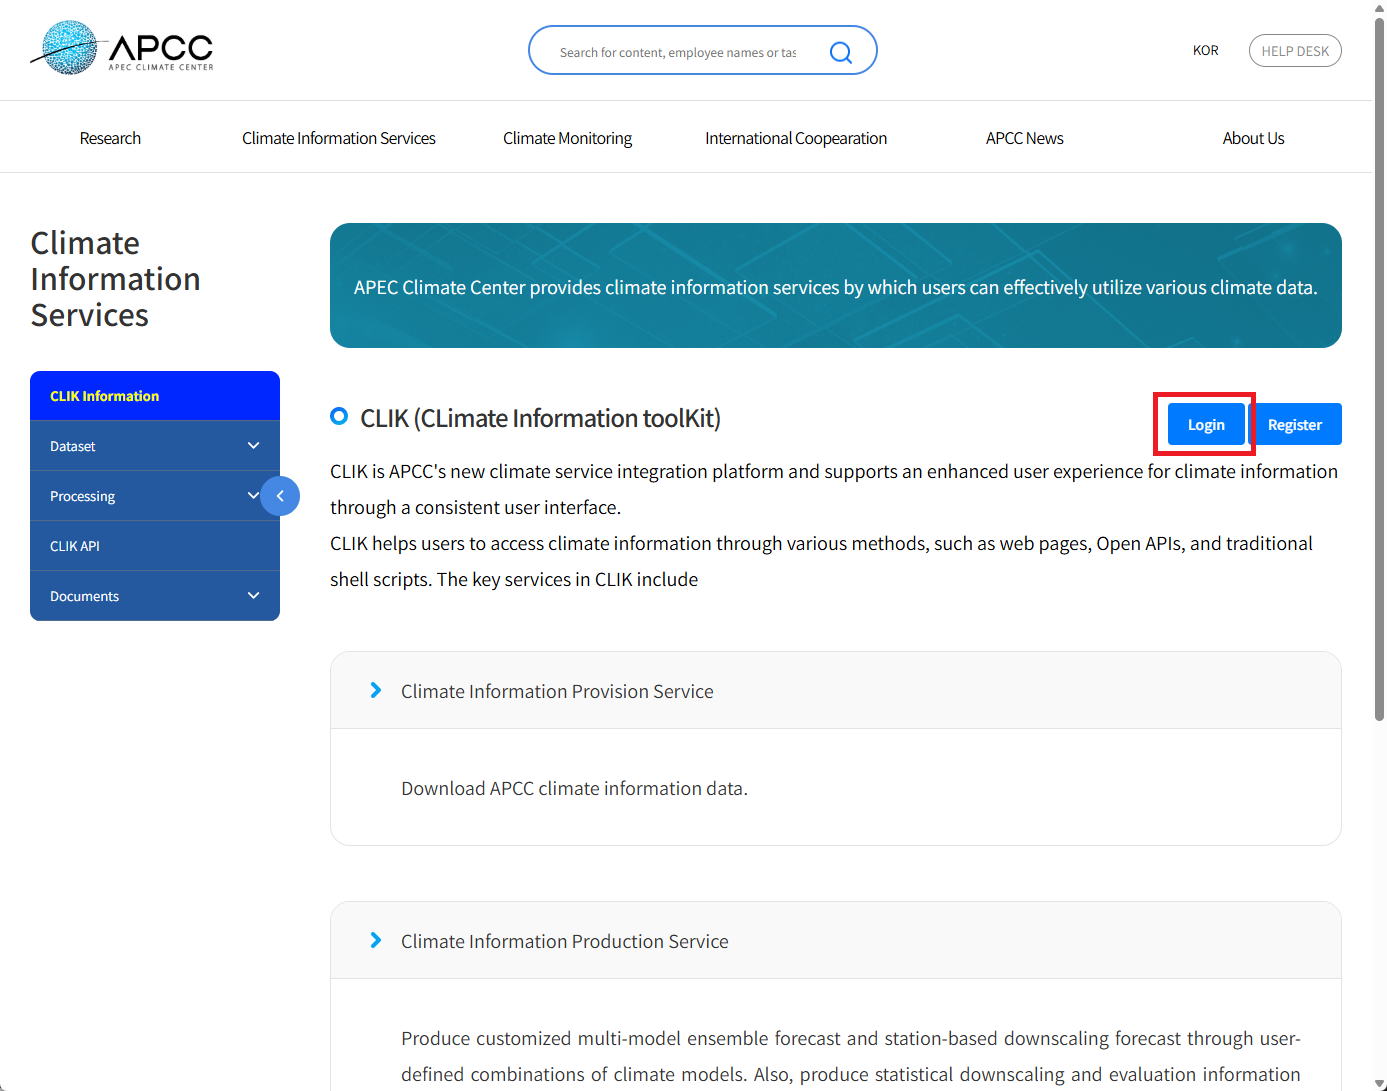
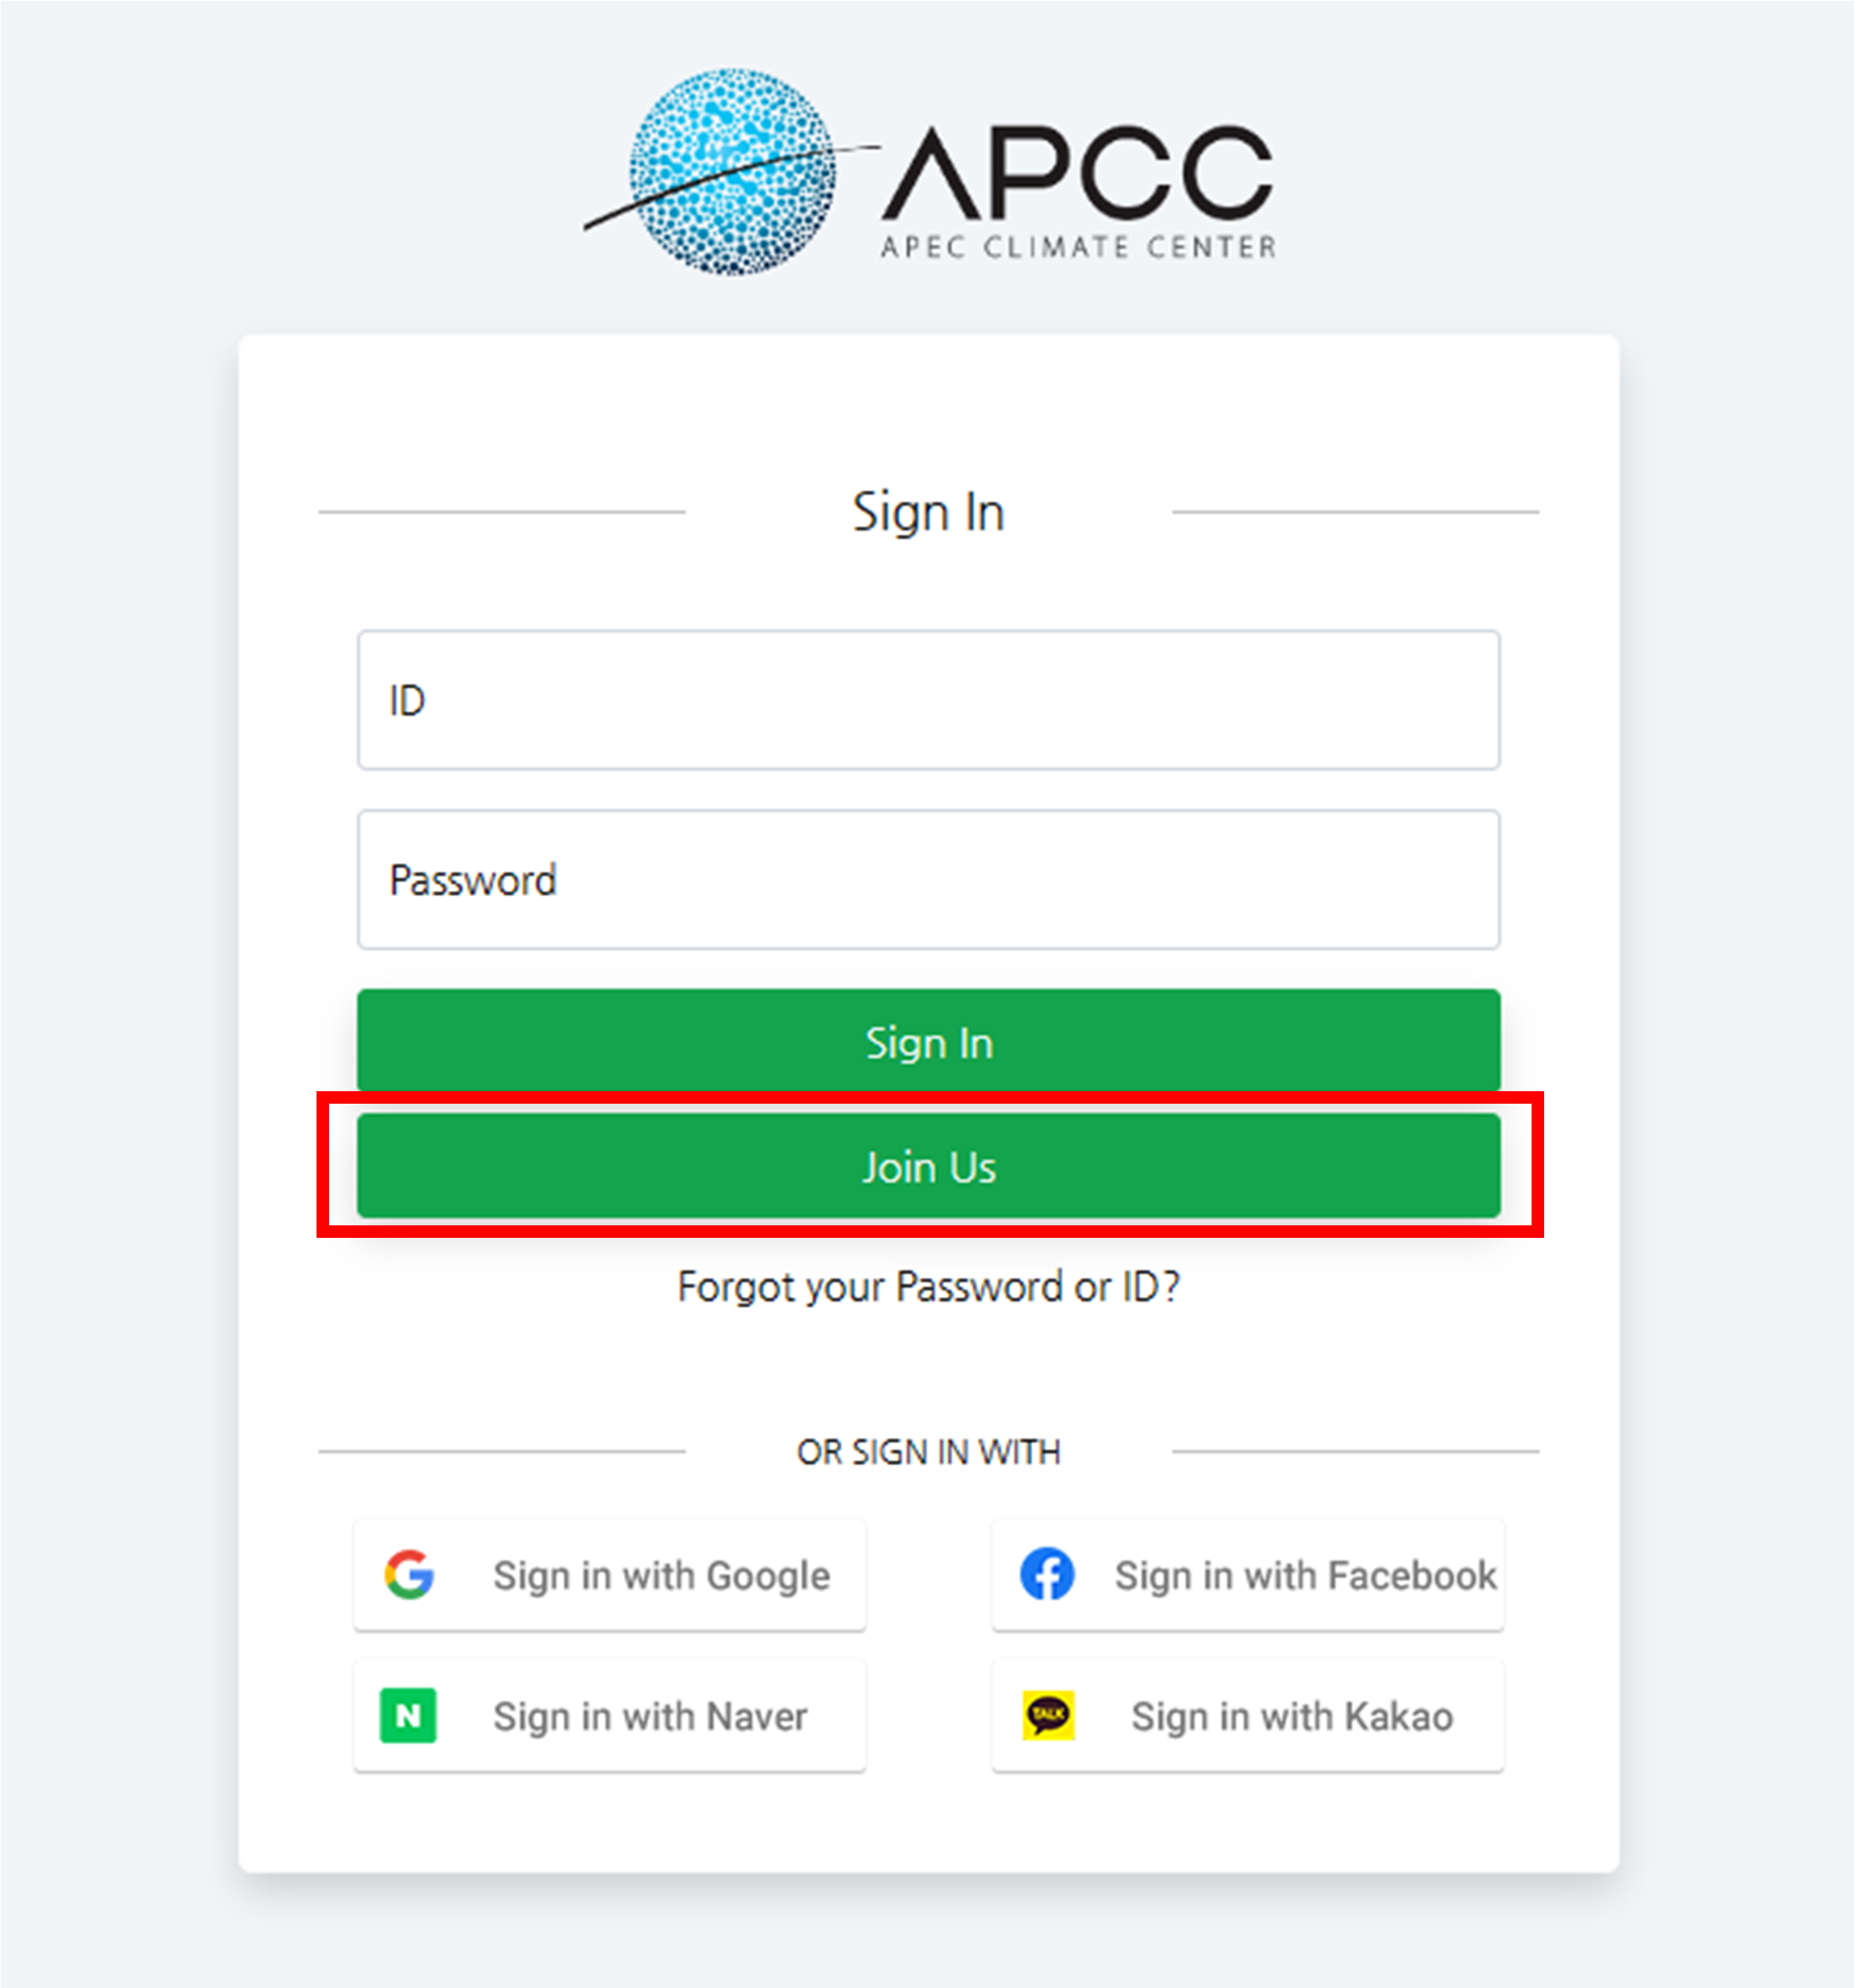
Access the CLIK (refer to ("Accessing CLIK")) and proceed with registration to utilize more diverse climate information and full CLIK functions. As shown in the figure below, select the 'Member' button on the top right and then select the 'Register' button to move to the registration page.
(Figure 1-2-1) Navigate to Member - Register Page
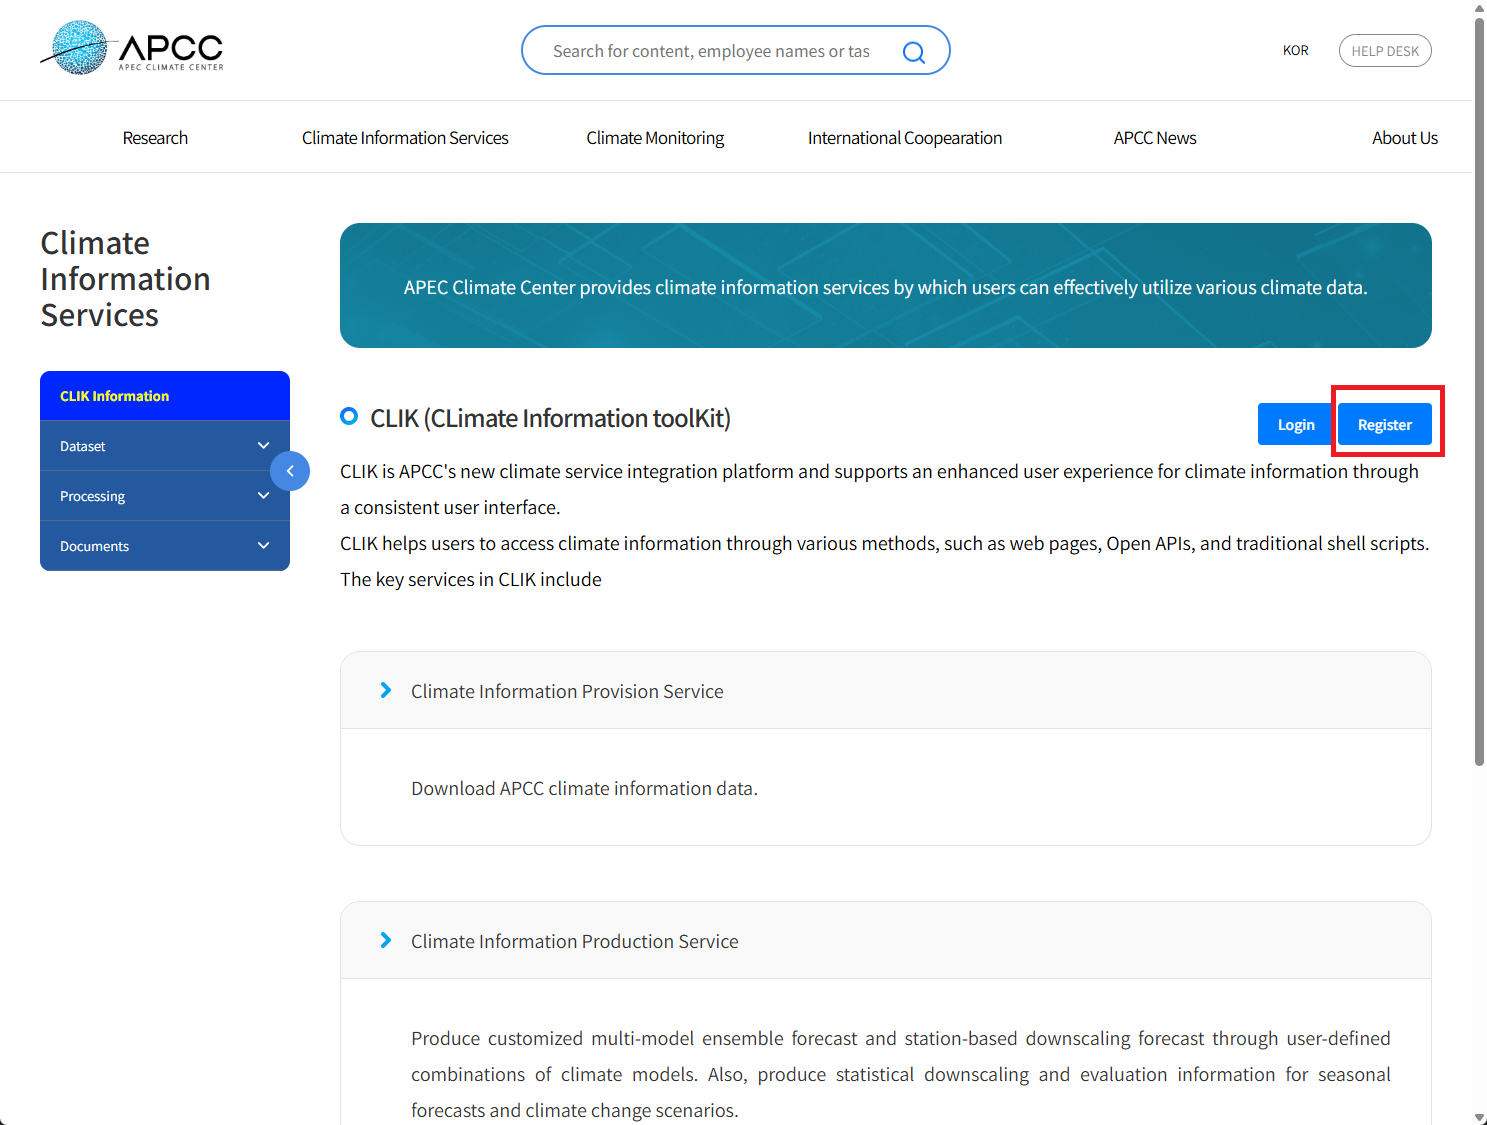
A. Registration Process (1)
You can sign up via general registration (Join Us) or through Google, Facebook, Naver, or Kakao accounts. Select your preferred method to proceed with registration.
(Figure 1-2-2) APCC SSO Registration Page (1)
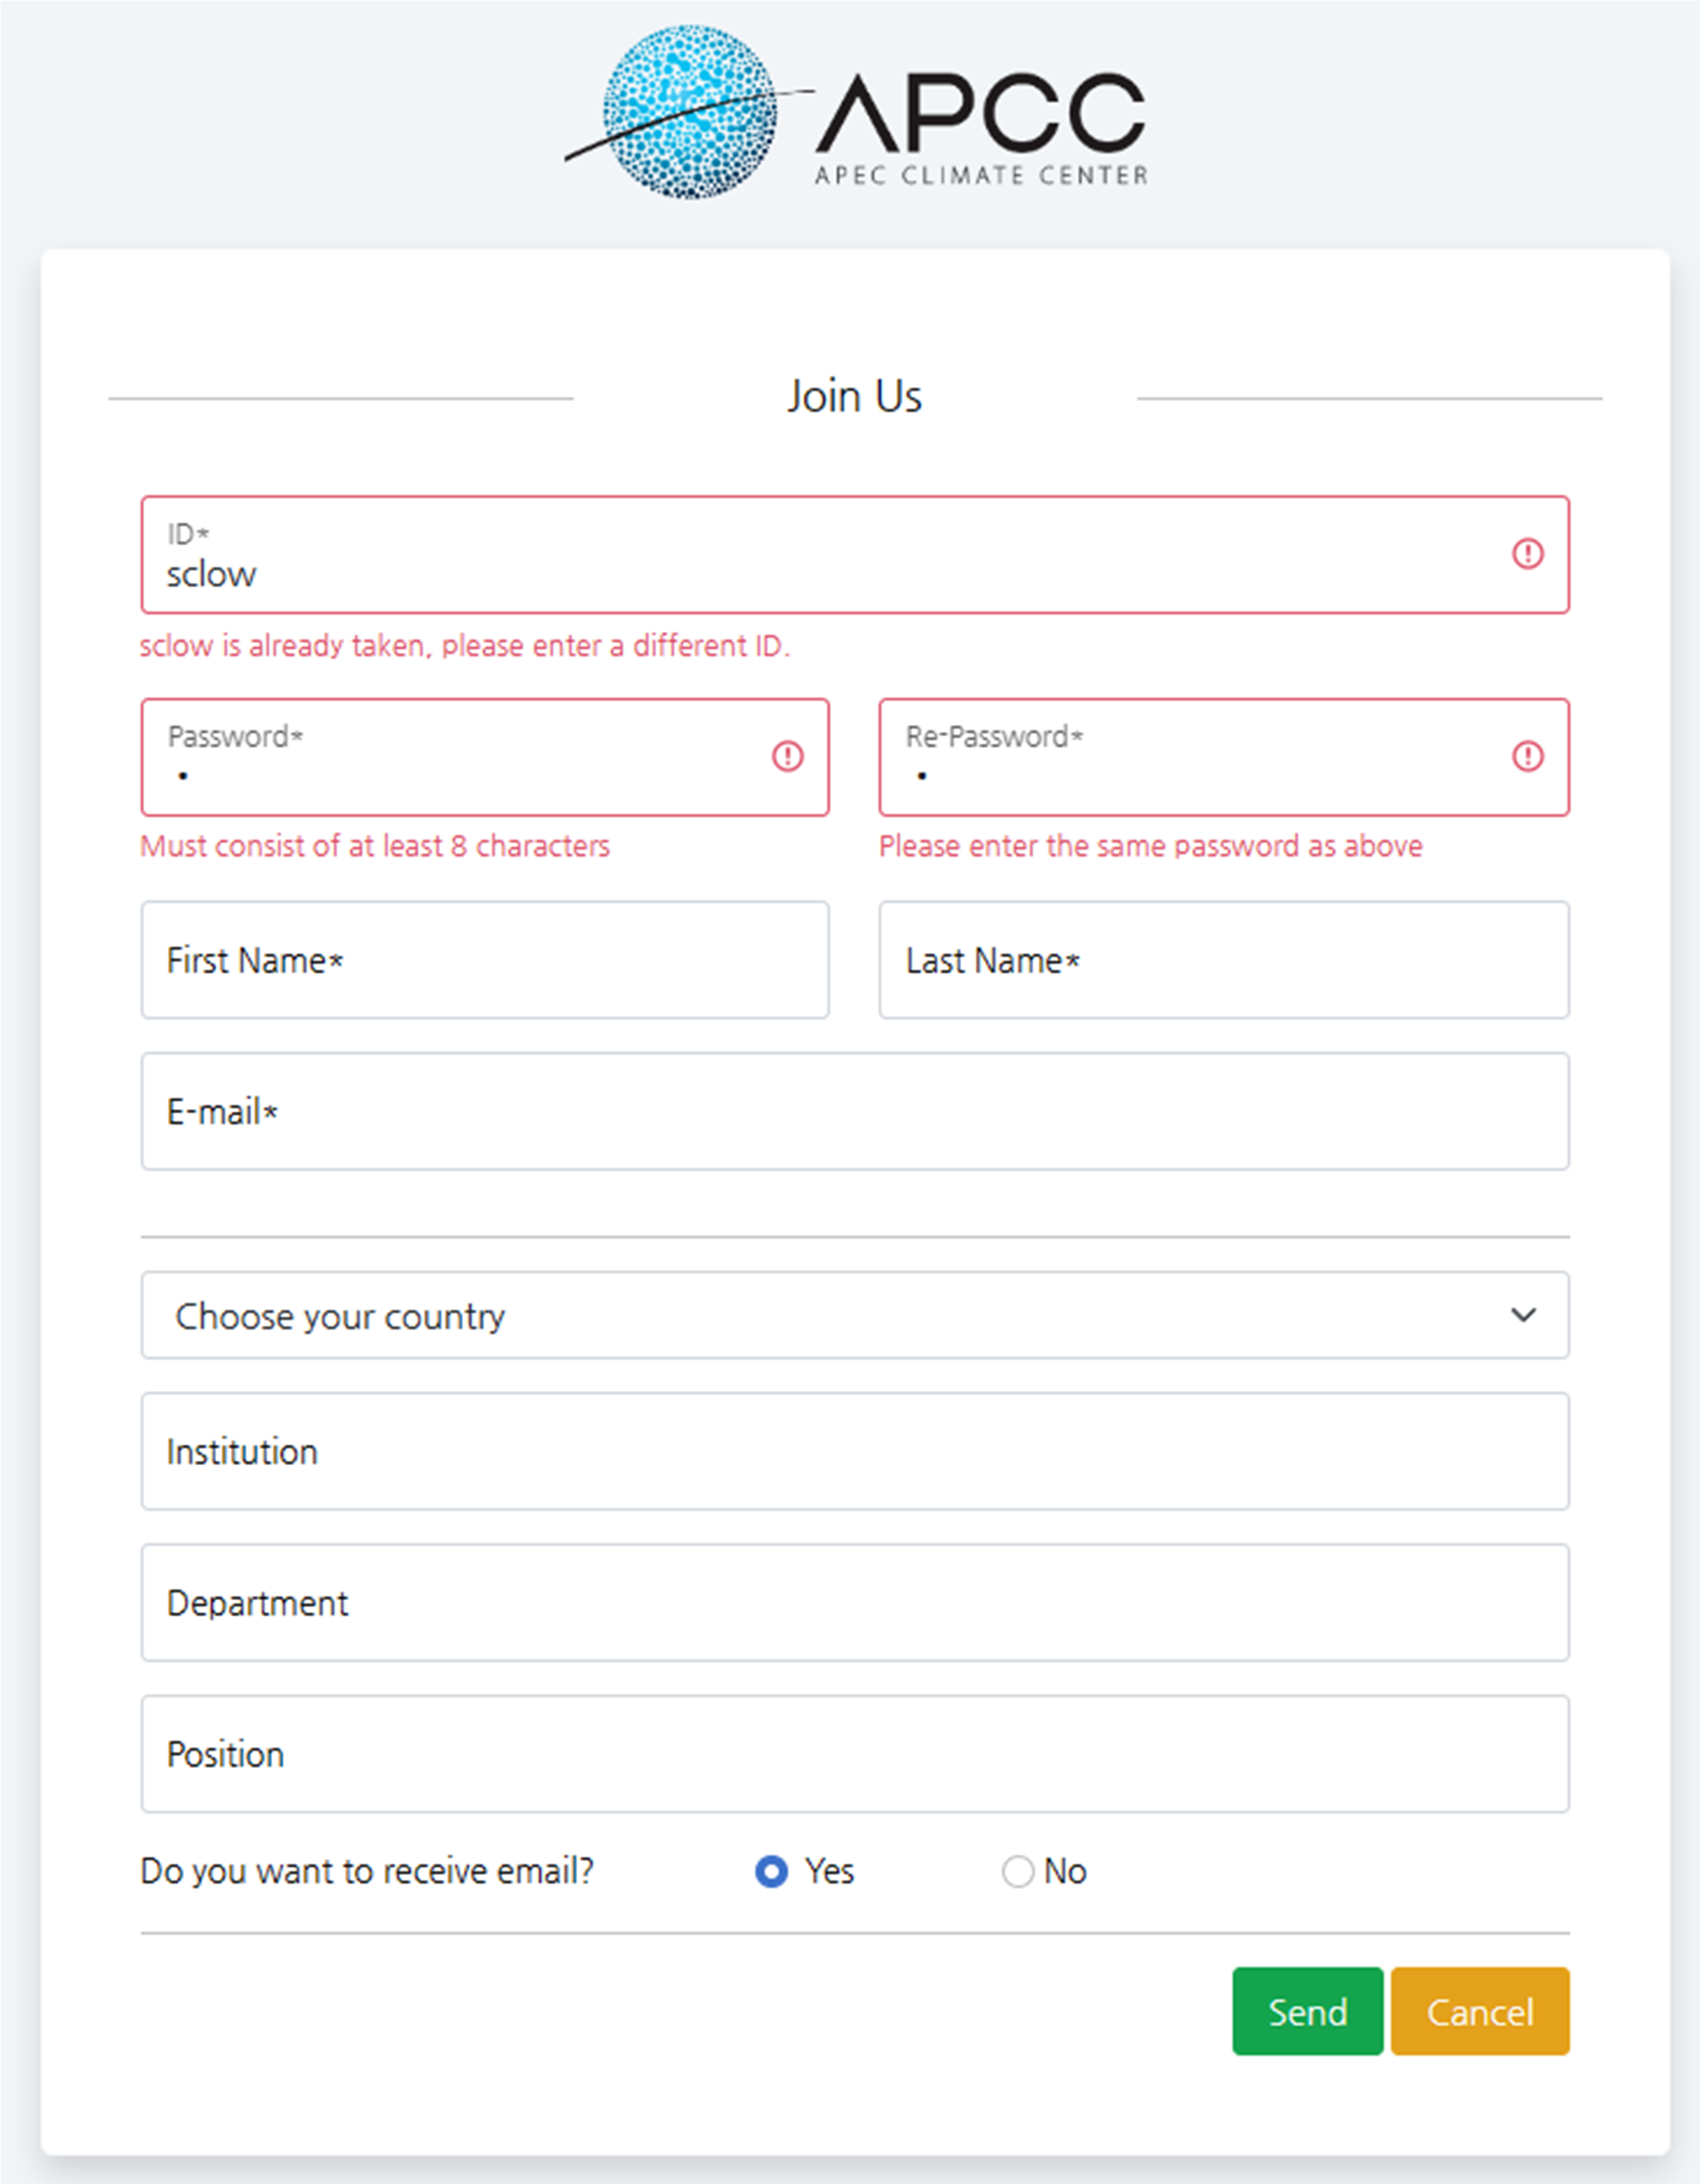
B. Registration Process (2)
Check the registration information and proceed by setting your ID (User ID) and personal information. (Items marked with * are mandatory.)

(Figure 1-2-3) APCC SSO Registration Page (2)
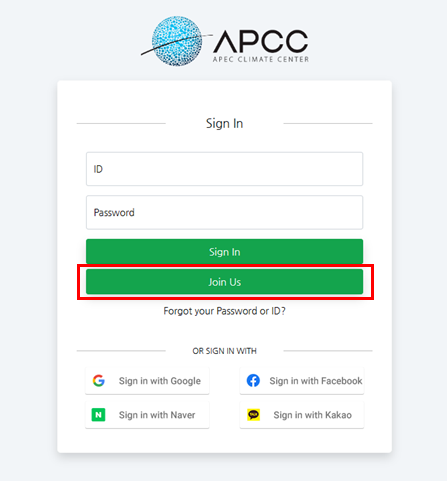
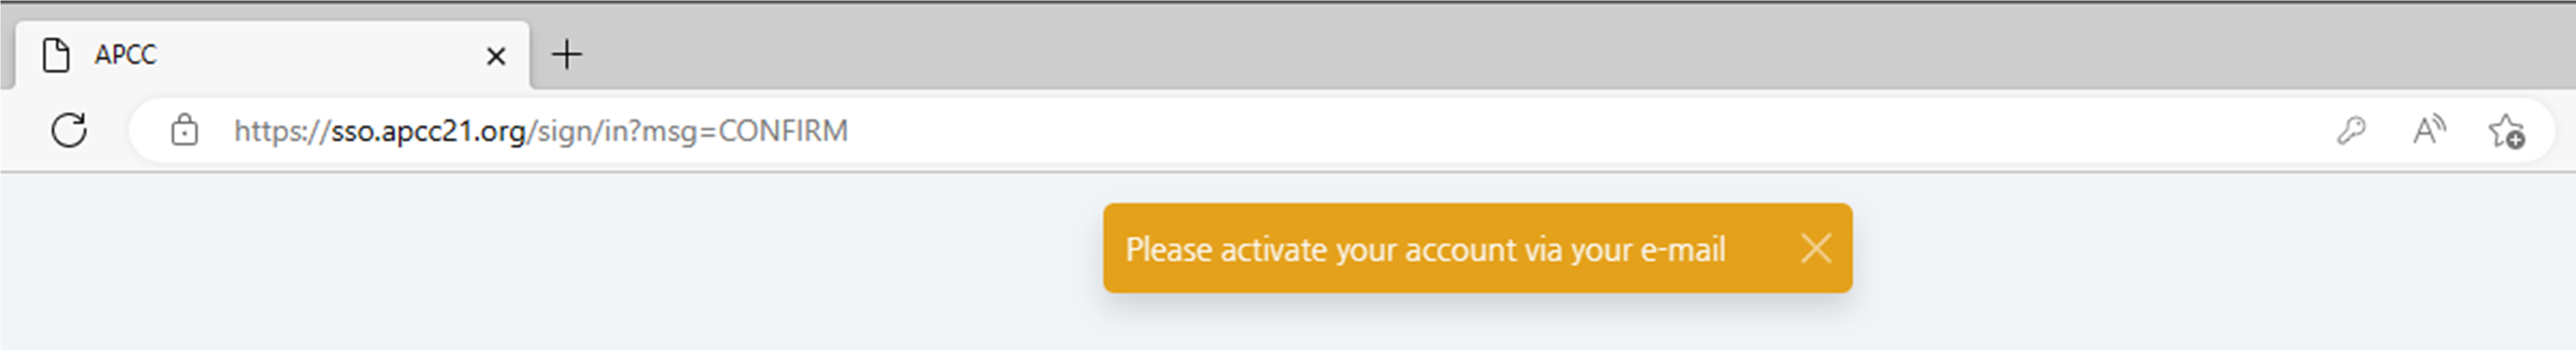
C. Email Verification
A verification email will be sent to the address registered during sign-up. You can activate your account through the link attached to the verification email. Once the account is activated, you can normally use all APCC services. Once the account is activated, you can normally use all APCC services. (If you do not receive the email, please check your spam folder as it may be treated as spam.)
(Figure 1-2-4) Registration Completion Popup Message
I. Easy Guide to CLIK
Login into CLIK
Access the CLIK (refer to "Accessing CLIK "), and select the 'Login' button as shown in the figure below.

(Figure 1-3-1) Member Menu > Click Login (Red Box)
Enter your Registered ID and Password to complete the login.

(Figure 1-3-2) ID/Password Input Field
I. Easy Guide to CLIK
Downloading APCC MME 3-Month Data Link
This section explains how to download APCC MME-3MON (3-Month MME) data.
A. Login
Log in to the CLIK (refer to "Login into CLIK"). If you are already logged in, you do not need to proceed further.

(Figure 1-4-1) Login
Enter ID and Password to complete login.

(Figure 1-4-2) Enter Registered ID and Password
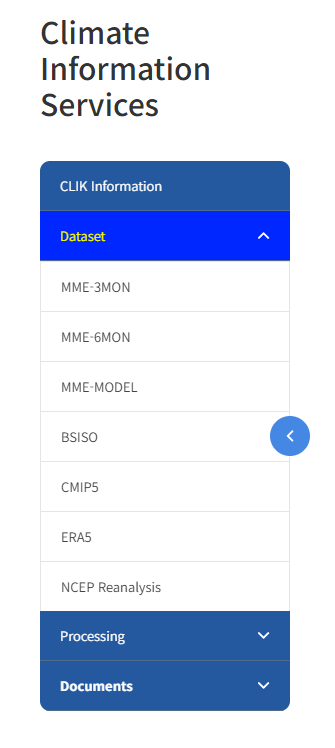
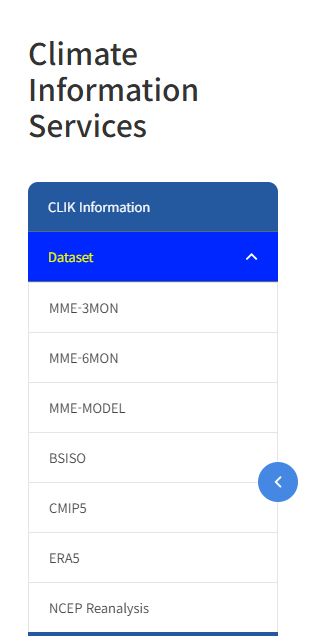
B. Select Dataset > MME-3MON Menu
Select the 'MME-3MON' menu, which is a submenu of the 'Dataset' menu, as shown in the figure below.
(Figure 1-4-3) Select MME-3MON Menu
C. Select Data Options
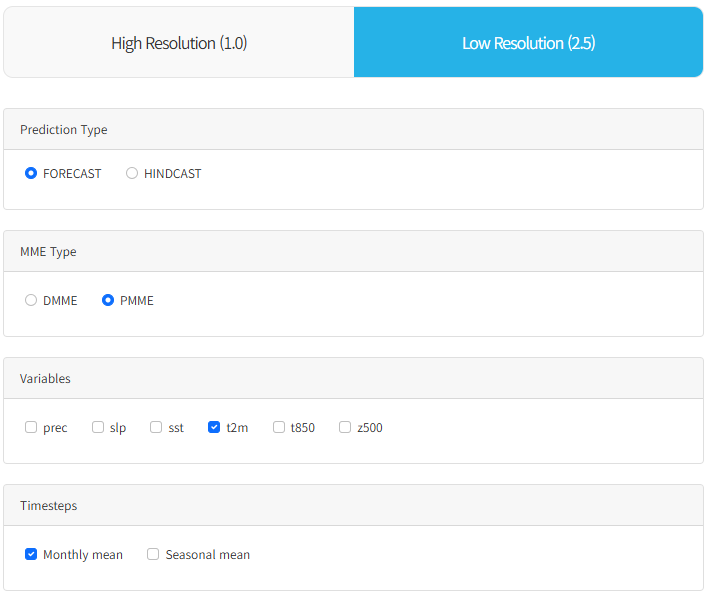
To download low resolution(2.5 deg) MME 3-month data, select 'Low Resolution' for the resolution, select 'Forecast' for the prediction type, and select 'PMME' (probabilistic prediction method) for the MME type. Then, select the 't2m' (2-meter temperature) variable and set the timestep to 'Monthly mean'. Set the options on the actual screen as shown below.
(Figure 1-4-4) Select Data Options
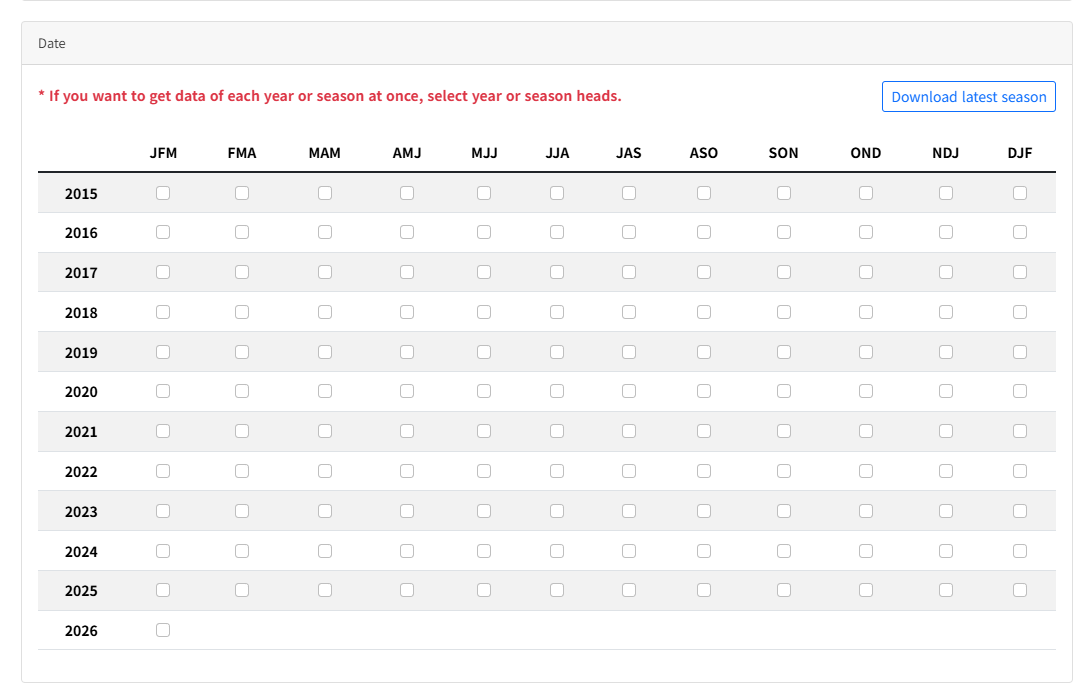
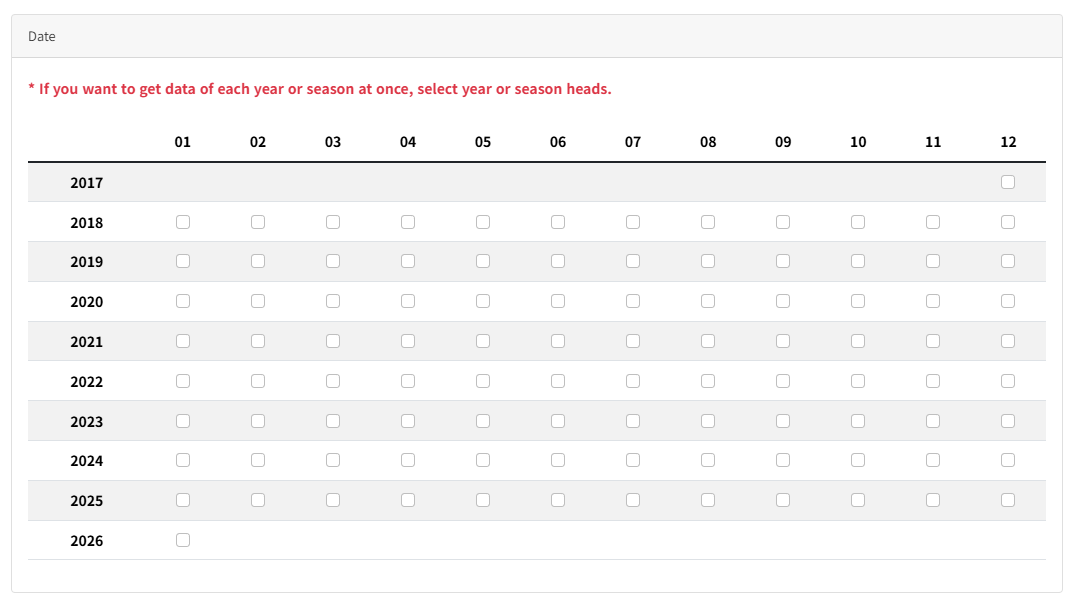
D. Select Year/Month (Select 2021)
Select the entire year 2021 for the data year/month. (To select the entire year, simply select the Arabic numeral for that year.)
(Figure 1-4-5) Select Data Year/Month
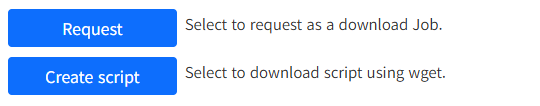
E. Request
After confirming the conditions above, create a user job by clicking the 'Request' button.
(Figure 1-4-6) Request Data
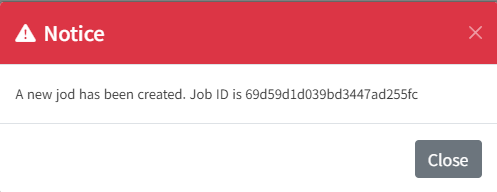
F. Check Job Entry
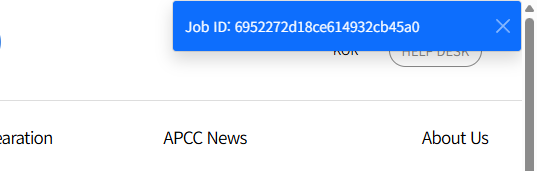
The job is created and the user request Job ID appears in the upper right corner of the screen. (It disappears automatically after moving pages or after a certain period of time.)
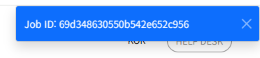
(Figure 1-4-7) Check Job Entry
G. Select My Jobs Menu
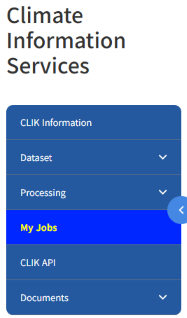
(Figure 1-4-8) My Jobs Menu
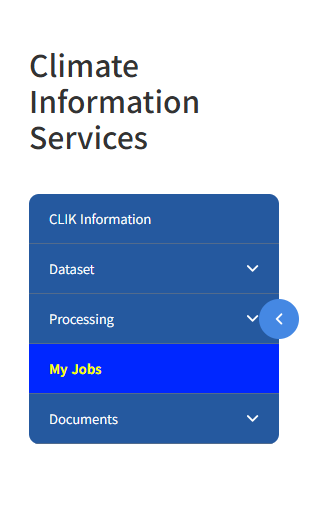
You can check the status of user request job creation by moving to the 'My Jobs' menu in the main menu as shown in the picture above. Clicking "My Jobs" allows you to check the current job progress or request download of completed data as shown below.
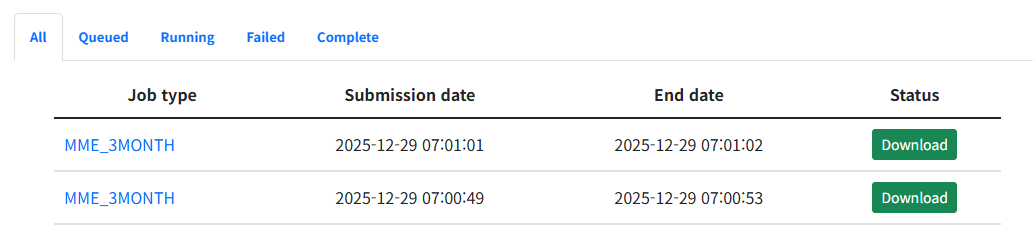
(Figure 1-4-9) Check Progress, Request Download via Download Button
MME 3-month climate data is provided as a compressed file (*.zip).
I. Easy Guide to CLIK
Downloading Individual Model Data Link
This section explains how to download APCC climate model 'SCOPS' data among the individual climate models data used for MME prediction.
A. Login
Log in to the CLIK (refer to "Login into CLIK"). If you are already logged in, you do not need to proceed further.

(Figure 1-5-1) Login
Enter ID and Password to complete login.

(Figure 1-5-2) Enter Registered ID and Password
B. Select Dataset > MME-MODEL Menu
Select the 'MME-MODEL' menu, which is a submenu of the 'Dataset' menu, as shown in the figure below.
(Figure 1-5-3) Select MME-MODEL Menu
C. Select Data Options
To download low resolution APCC SCOPS model data, select 'Low Resolution' for the resolution, select 'Forecast' for the prediction type and select 'APCC' for the Institute. Then, select 'SCOPS' for the Model, and select 'prec' (Precipitation) and 't2m' (2-meter Temperature) variables. Set the options on the actual screen as shown below.
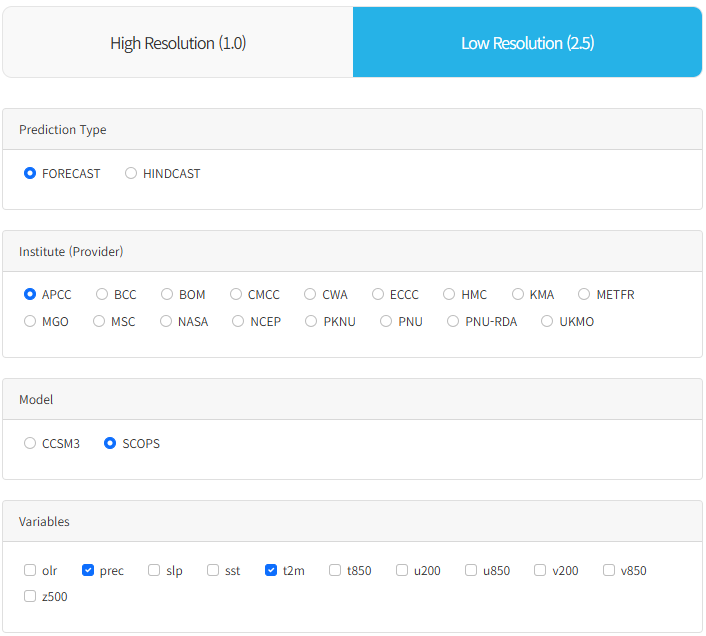
(Figure 1-5-4) Select Data Options
D. Select Year/Month (Select 2021)
Select the entire year 2021 for the data year/month. (To select the entire year, simply select the Arabic numeral for that year.)
(Figure 1-5-5) Select Data Year/Month
E. Request
After confirming the conditions above, create a user job by clicking the 'Request' button.

(Figure 1-5-6) Request Data
F. Check Job Entry
The job is created and the user request Job ID appears in the upper right corner of the screen. (It disappears automatically after moving pages or after a certain period of time.)
(Figure 1-5-7) Check Job Entry
G. Select My Jobs Menu
(Figure 1-5-8) My Jobs Menu
You can check the status of user request job creation by moving to the 'My Jobs' menu in the main menu as shown in the picture above. Clicking "My Jobs" allows you to check the current job progress or request download of completed data as shown below.
(Figure 1-5-9) Check Progress, Request Download via Download Button
APCC SCOPS individual model climate data is provided as a compressed file (*.zip).
I. Easy Guide to CLIK
Seasonal Prediction (Deterministic-DMME) Tutorial Link
This section explains how to generate, check, and download seasonal prediction data using the Deterministic method in the Prediction menu.
A. Login
Log in to the CLIK (refer to "Login into CLIK"). If you are already logged in, you do not need to proceed further.

(Figure 1-6-1) Login
Enter ID and Password to complete login.

(Figure 1-6-2) Enter Registered ID and Password
B. Select Processing > Prediction Menu
Select the 'Prediction' menu, a submenu of the 'Processing' menu, as shown in the figure below.
(Figure 1-6-3) Select Prediction Menu
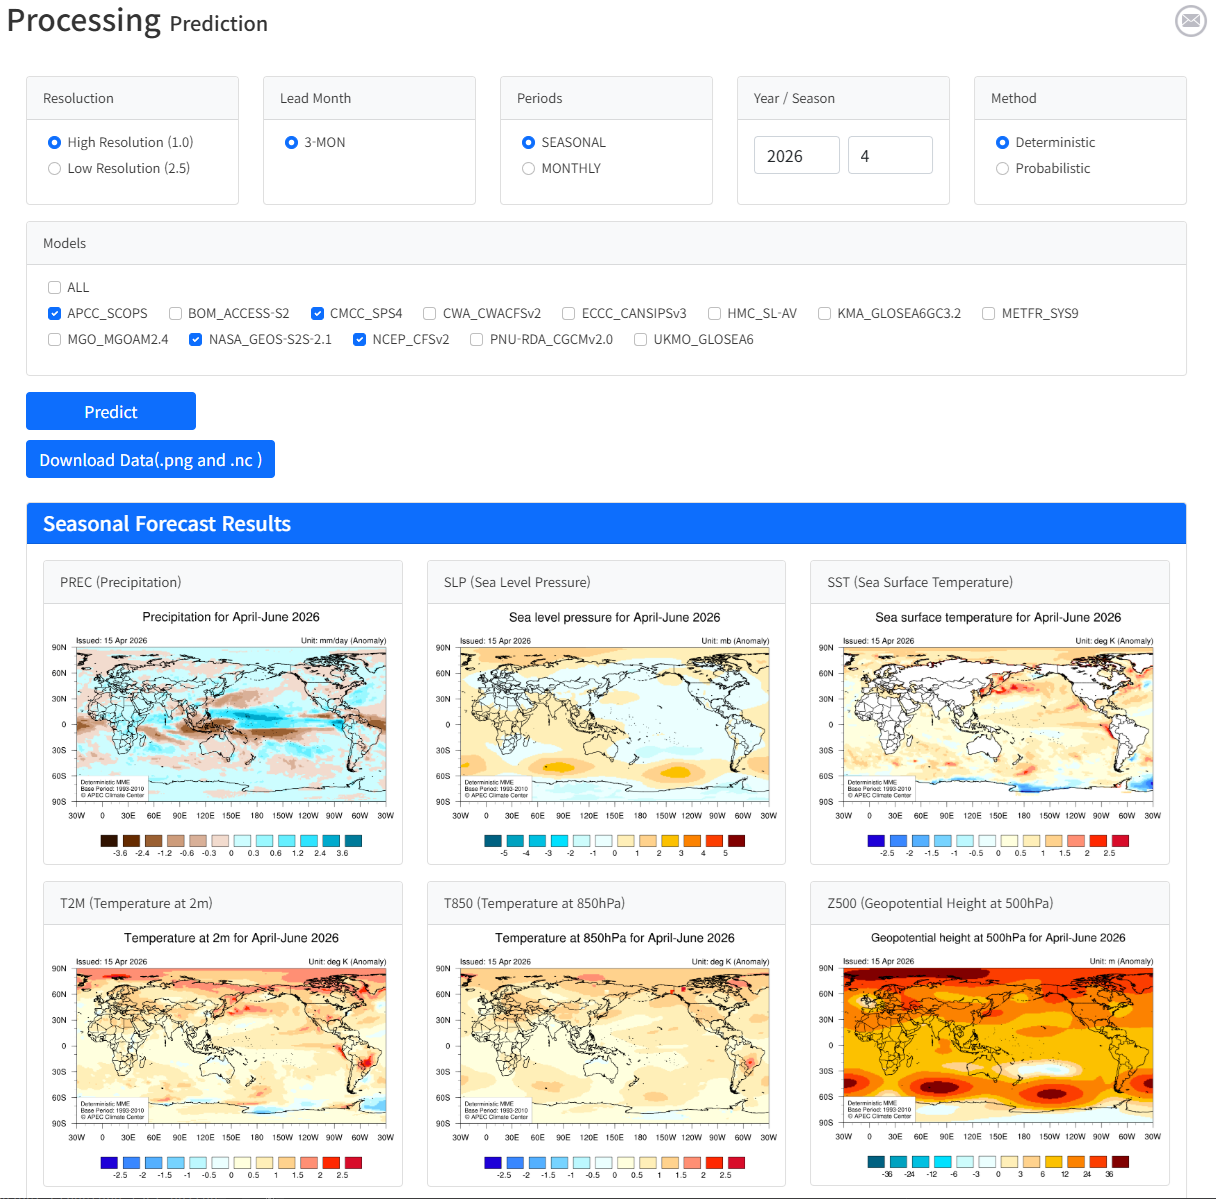
C. Select Seasonal Prediction Options
To generate seasonal prediction data using the deterministic prediction method, select the desired resolution between high resolution and low resolution, select a 3-month lead time, and set the desired year and month (in this example, April 2026 is selected). Select 'Deterministic' for the prediction method and choose the desired climate models. In this example, four climate models are selected (APCC_SCOPS, CMCC_SPS4, NASA_GEOS-S2S-2.1, NCEP_CFSv2). Set the options on the actual screen as shown below.
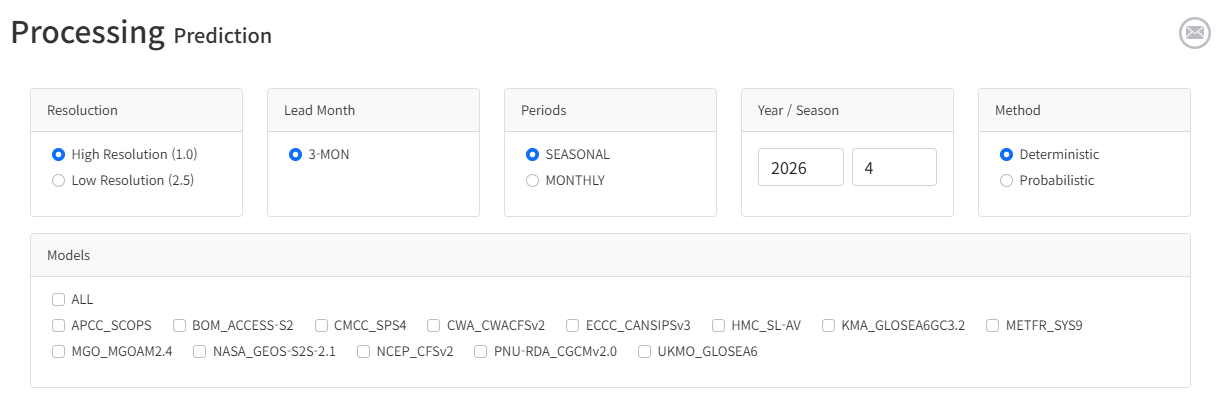
(Figure 1-6-4) Select Seasonal Prediction Options
D. Cases where Seasonal Prediction Results are Missing
If there are no results in the CLIK system for the seasonal prediction options selected by the user, create a job for prediction as shown in the figure below.
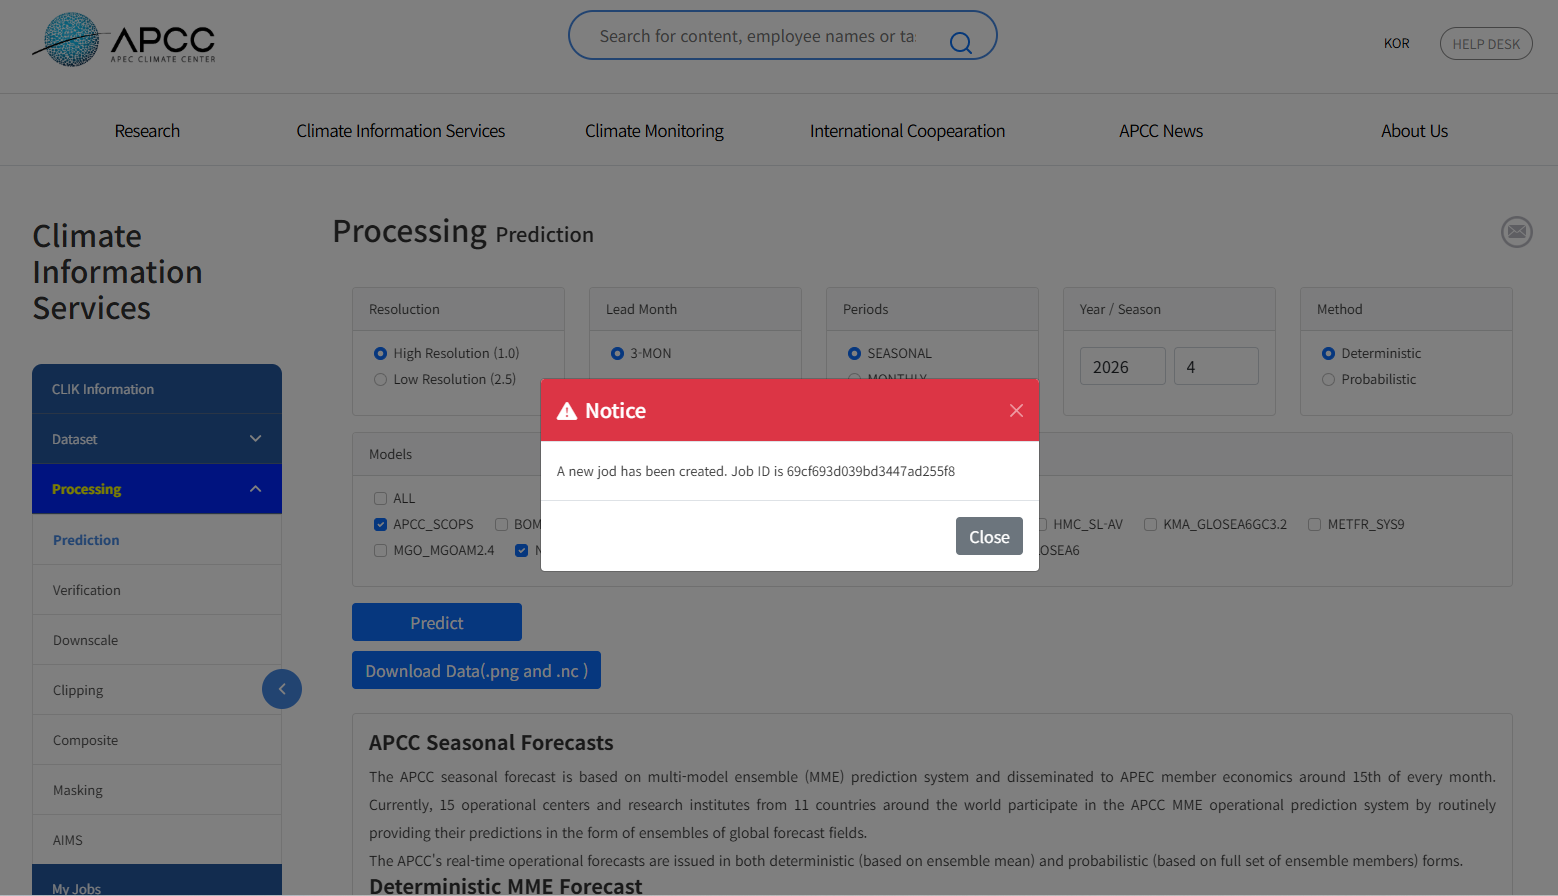
(Figure 1-6-5) Create Job as Selected Seasonal Prediction Result Does Not Exist
Click the 'My Jobs' menu to check the currently progressing prediction job as shown in the figure below.
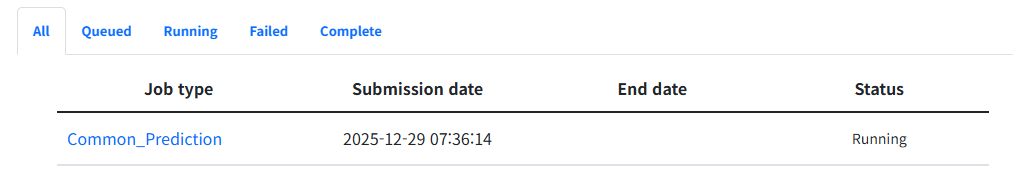
(Figure 1-6-6) Check Job Progress
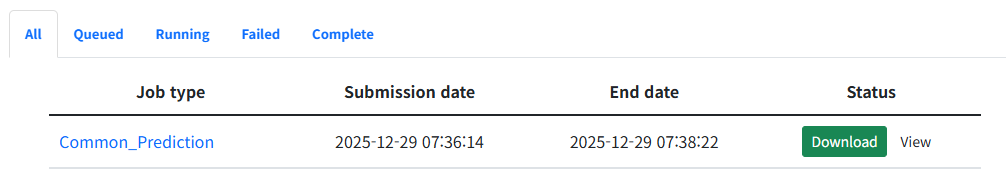
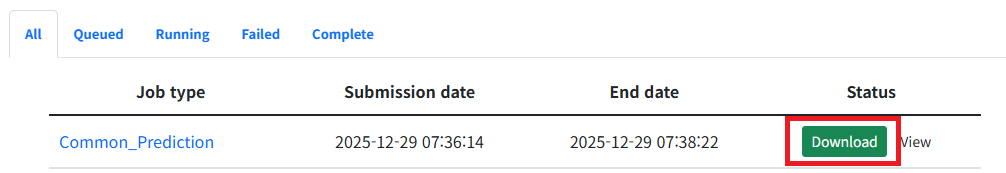
When the user-requested seasonal prediction generation job is completed, the 'Download' button to download data and the 'View' button to check results on the screen become active as shown below.
(Figure 1-6-7) Download and View Results Buttons Activated
When the seasonal prediction generation job is completed, a job completion notification email is sent to the email address registered during sign-up. If the calculation time for seasonal prediction takes a long time, you can do other work and come back to the CLIK to check after receiving the job completion notification email.
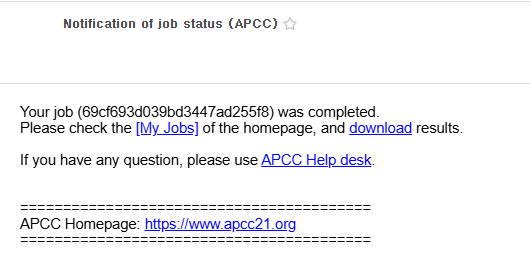
(Figure 1-6-8) Job Completion Notification Email
E. Cases where Seasonal Prediction Results Already Exist
If the CLIK already has seasonal prediction results for the options selected by the user, the results are immediately displayed on the screen.
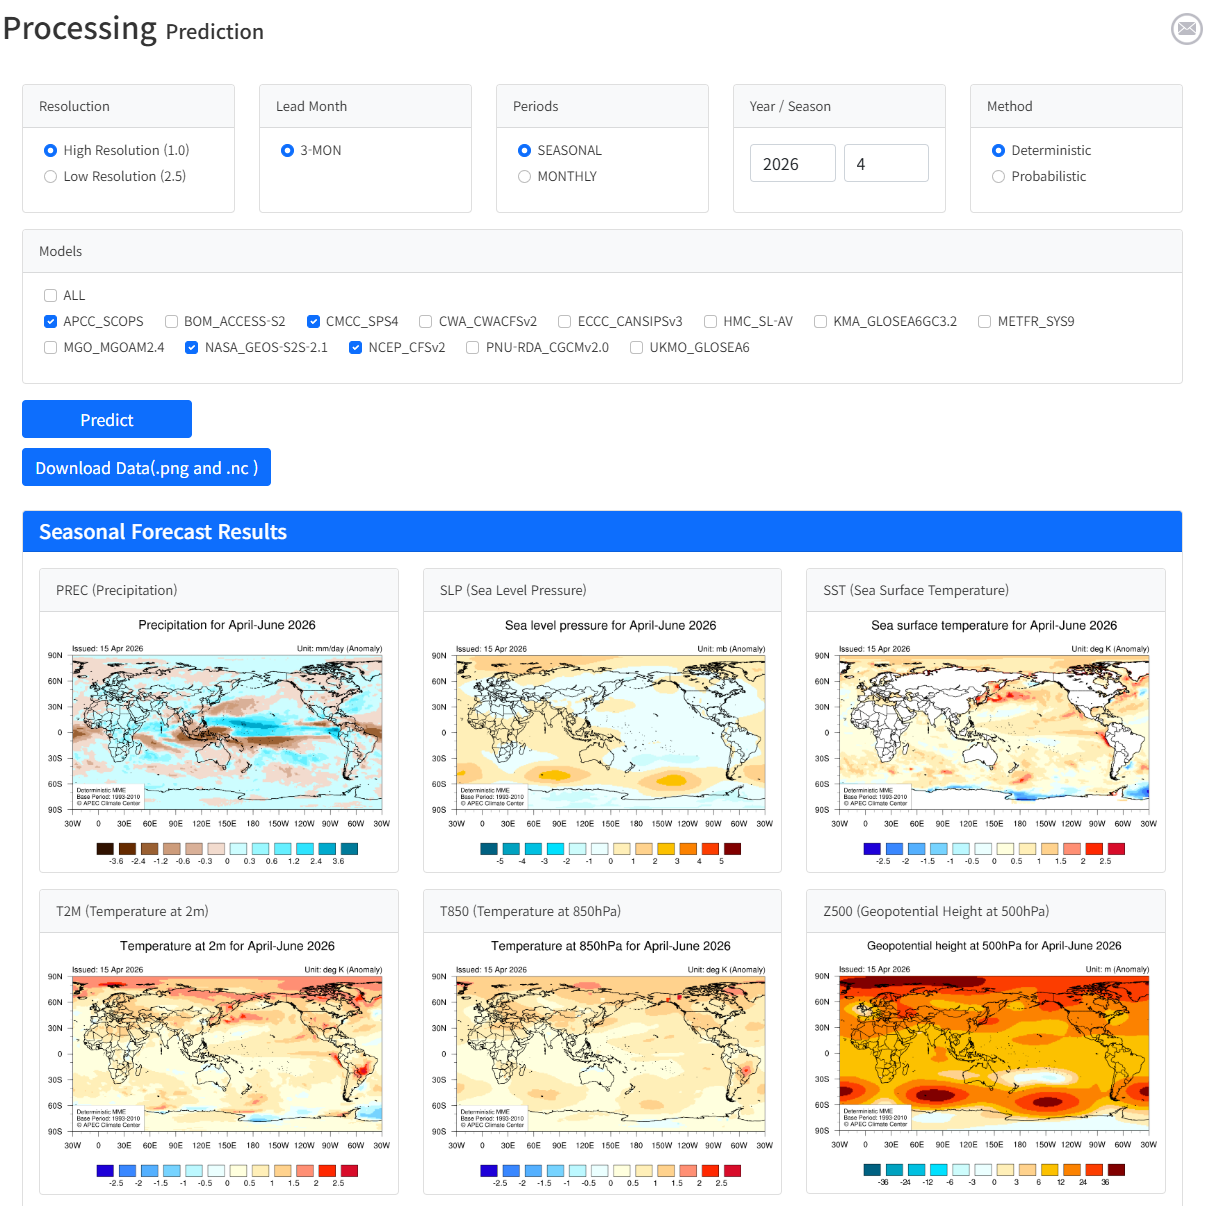
(Figure 1-6-9) Seasonal Prediction Result
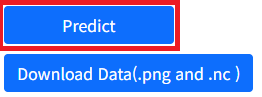
If you download the data using the Download Data (.png and .nc) button on the screen above, the results by seasonal prediction variable are saved as a compressed file. Unzipping the file reveals both the image files and NetCDF files for the same seasonal prediction results, as shown below.
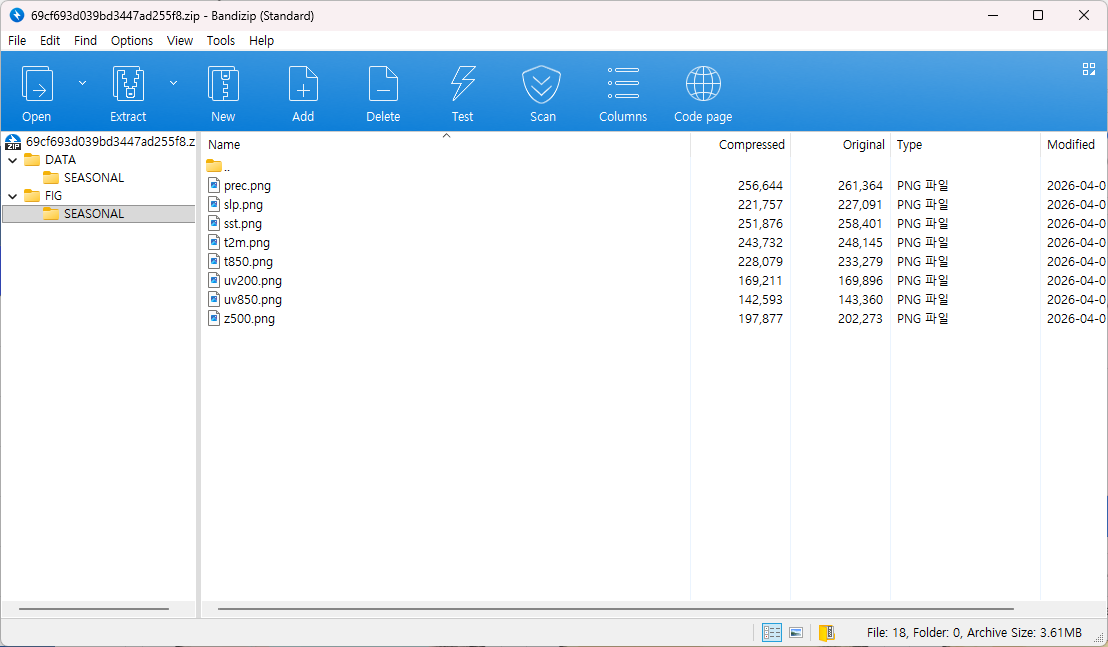
(Figure 1-6-10) Downloaded Image Files
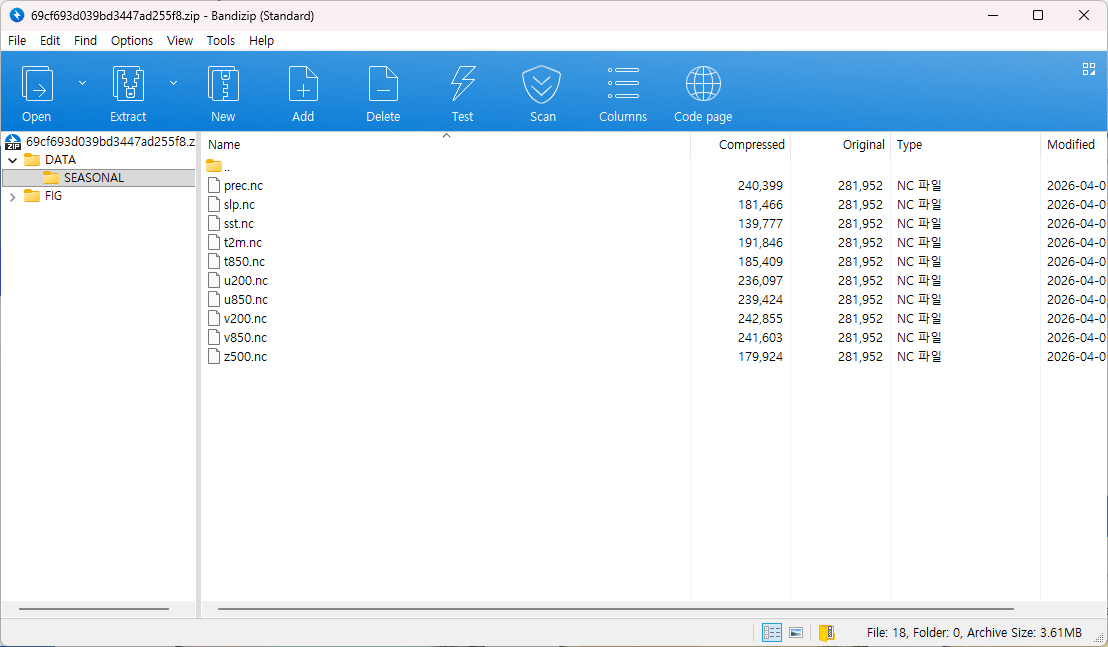
(Figure 1-6-11) Downloaded NetCDF Files
When downloading seasonal prediction results using the Download button on the screen where the My Jobs menu is selected, you can confirm that image files and NetCDF files are included together.
(Figure 1-6-12) Result of File Download using Download Button on My Jobs Page
I. Easy Guide to CLIK
Verification Tutorial Link
This section explains how to generate, check, and download verification data in the Verification menu.
A. Login
Log in to the CLIK (refer to "Login into CLIK"). If you are already logged in, you do not need to proceed further.
(Figure 1-7-1) Login
Enter ID and Password to complete login.

(Figure 1-7-2) Enter Registered ID and Password
B. Select Processing > Verification Menu
Select the 'Verification' menu, a submenu of the 'Processing' menu, as shown in the figure below.
(Figure 1-7-3) Select Verification Menu
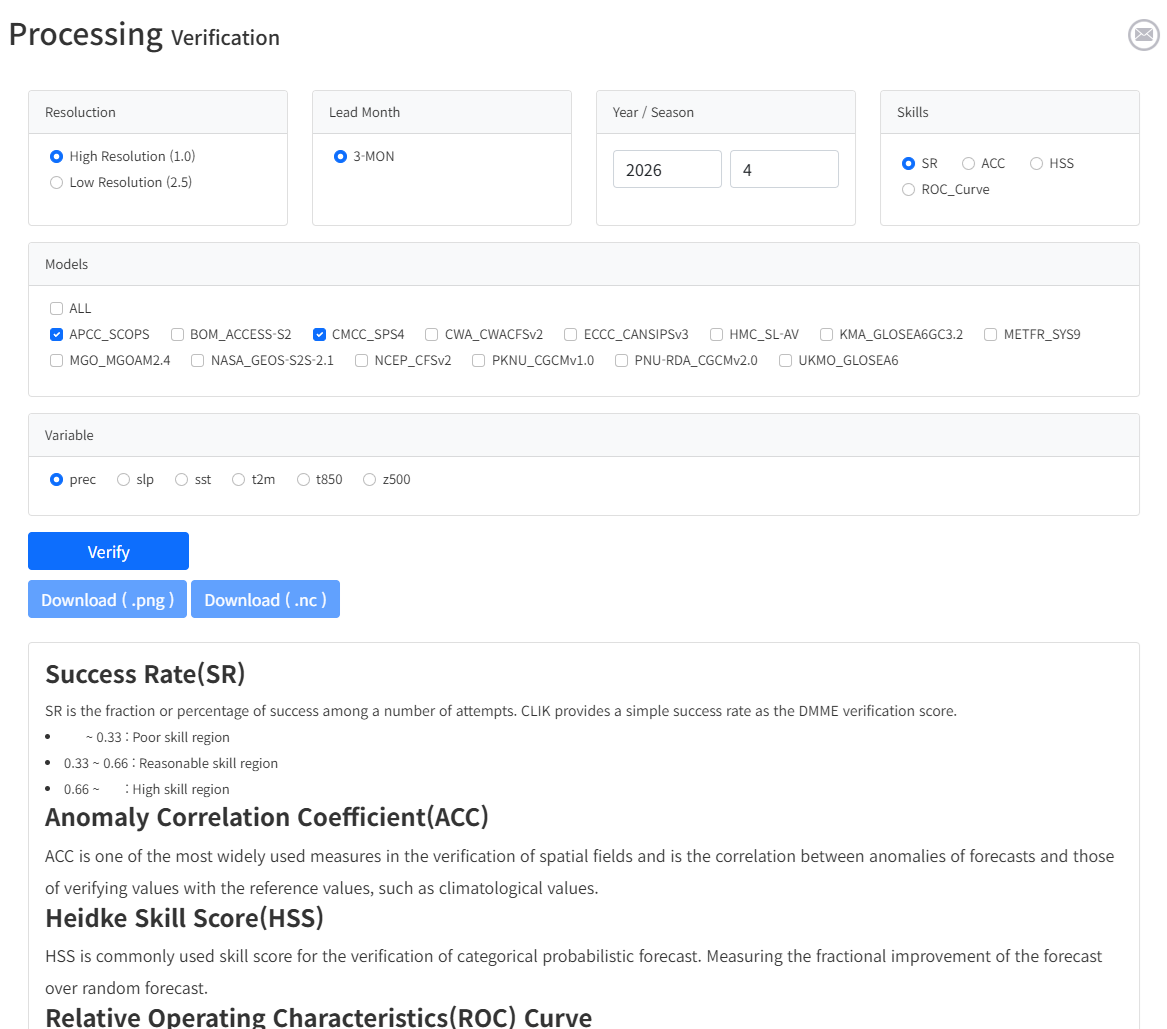
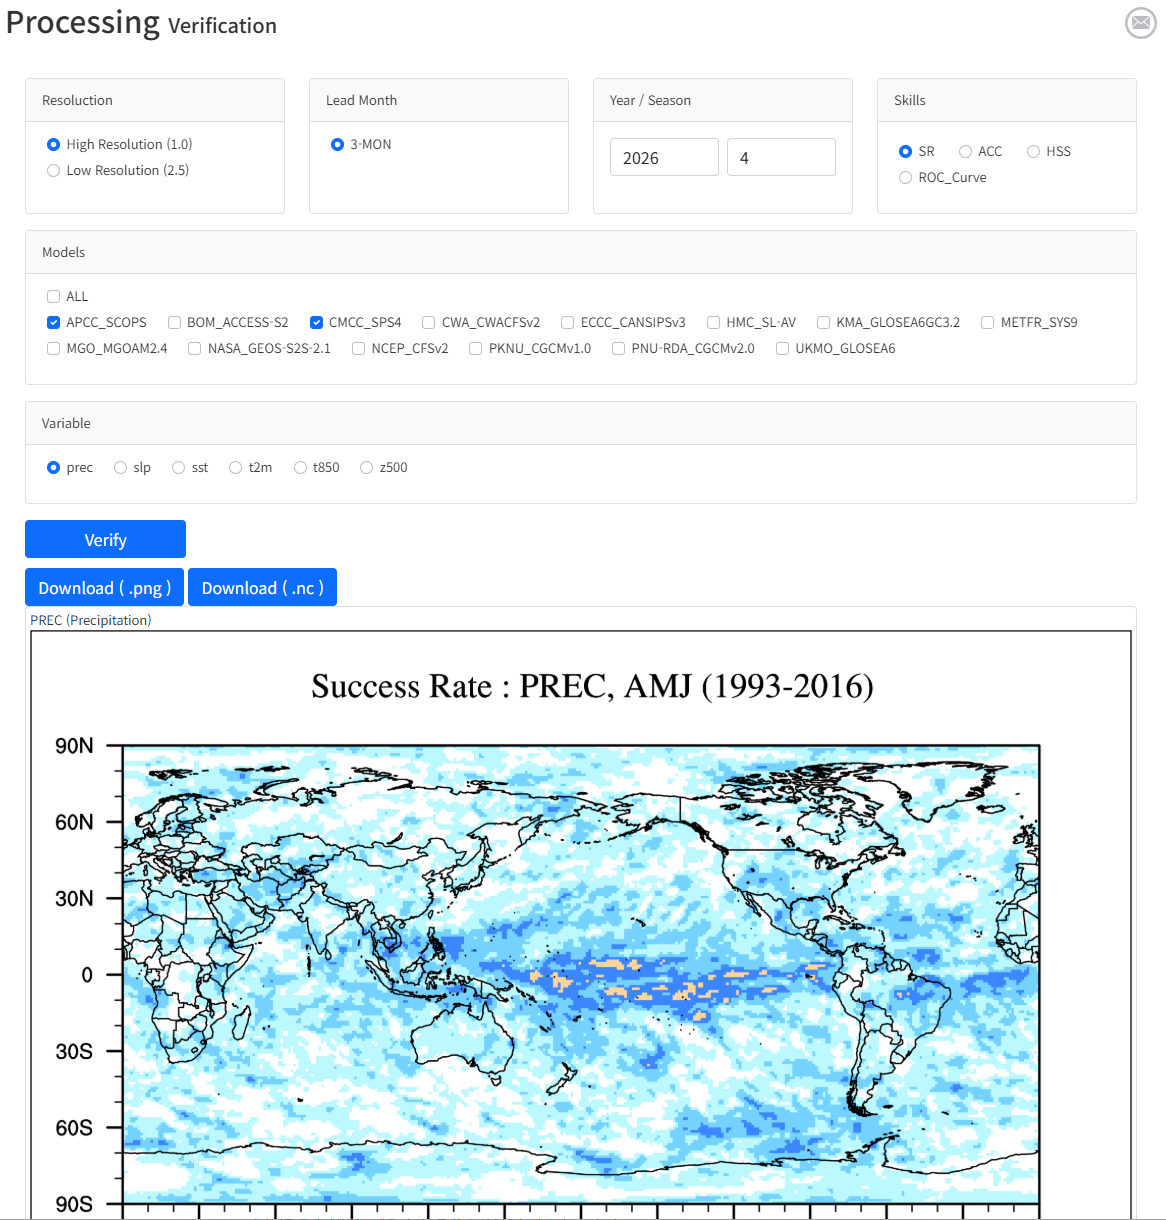
C. Select Verification Options
To generate verification data, select the desired resolution between high resolution and low resolution, and select a 3-month lead time. Set the desired year and month (in this example, April 2026 is selected). Select SR (Success Rate) for the skill method, precipitation (prec) for the climate variable, and choose the desired climate models. In this example, two climate models are selected (APCC_SCOPS, CMCC_SPS4). Set the options on the actual screen as shown below.
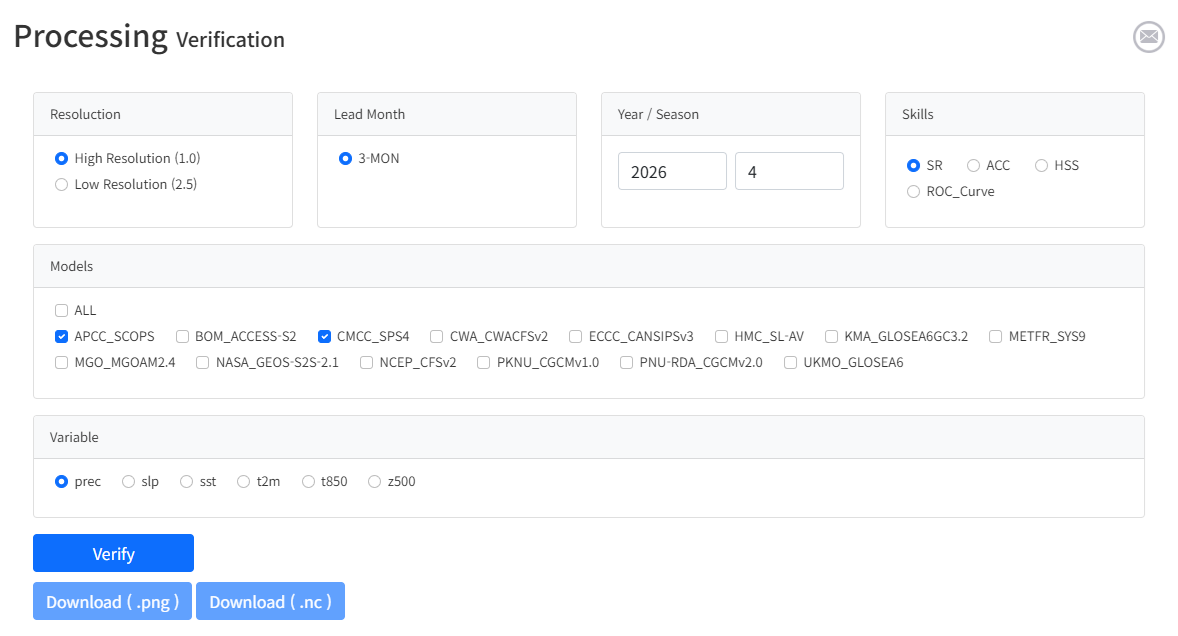
(Figure 1-7-4) Select Verification Options
D. Cases where Verification Results are Missing
If there are no results in the CLIK system for the verification options selected by the user, create a job to generate verification data as shown in the figure below.
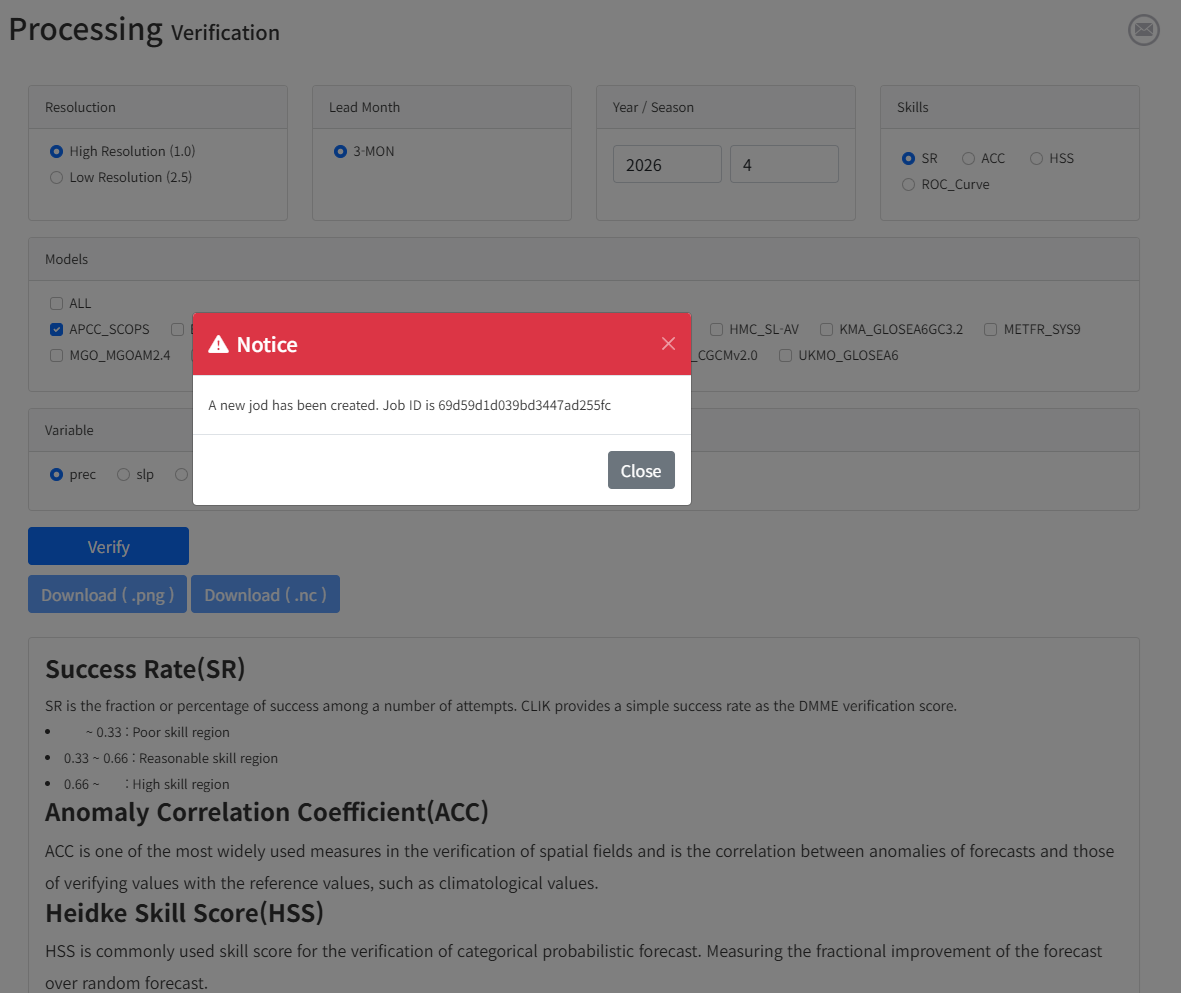
(Figure 1-7-5) Create Job as Selected Verification Result Does Not Exist
Click the 'My Jobs' menu to check the currently progressing verification result generation job as shown in the figure below.

(Figure 1-7-6) Check Job Progress
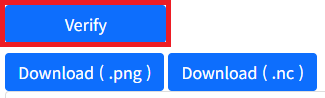
When the user-requested verification data generation job is completed, the 'Download' button to download data and the 'View' button to check results on the screen become active as shown below.

(Figure 1-7-7) Download and View Results Buttons Activated
When the verification data generation job is completed, a job completion notification email is sent to the email address registered during sign-up. If the calculation time for verification data generation takes a long time, you can do other work and come back to the CLIK to check after receiving the job completion notification email.
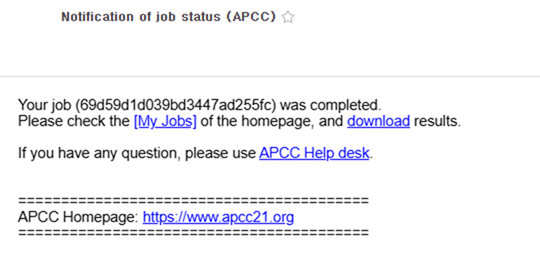
(Figure 1-7-8) Job Completion Notification Email
E. Cases where Verification Results Already Exist
If the CLIK already has verification results for the options selected by the user, the results are immediately displayed on the screen.
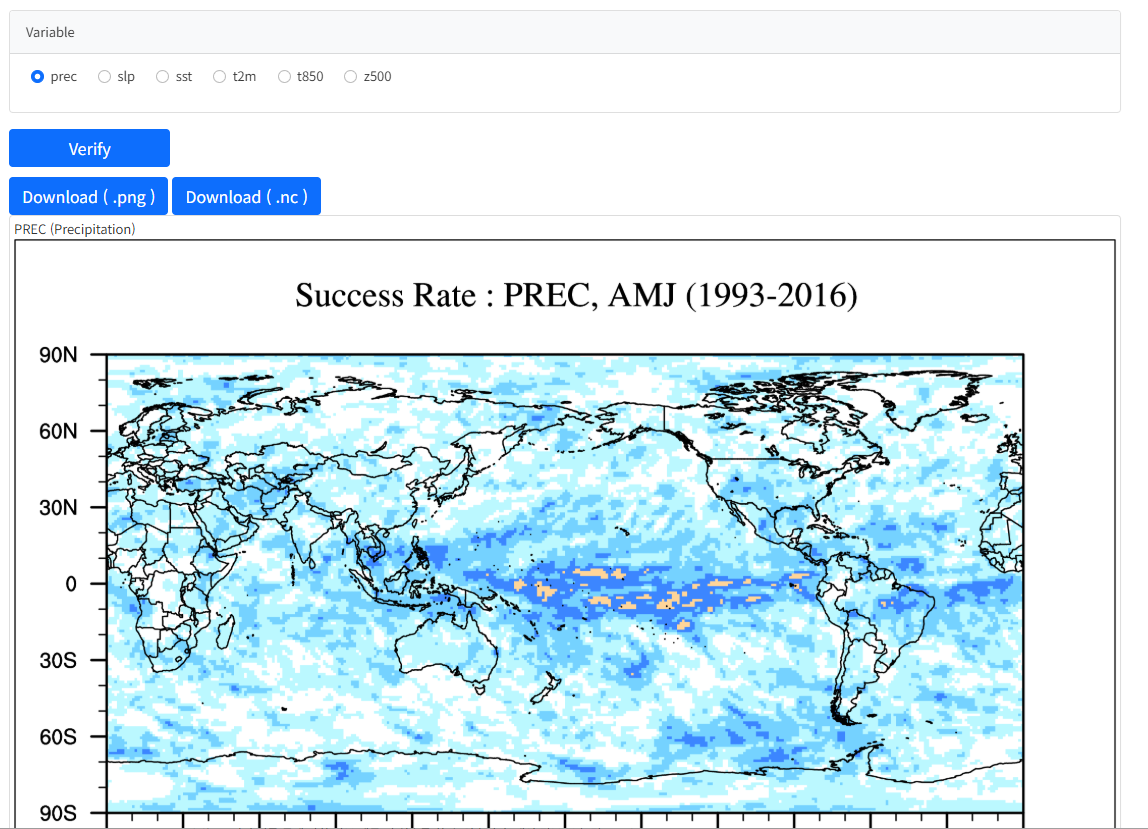
(Figure 1-7-9) SR Verification Result
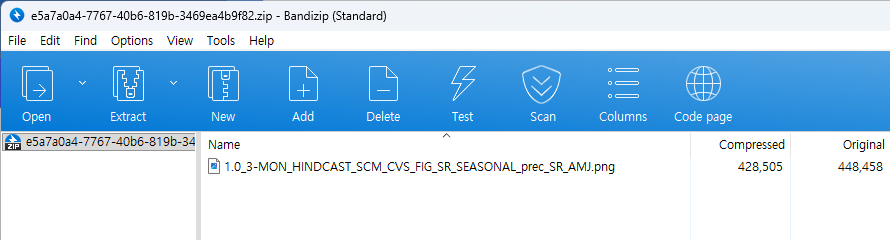
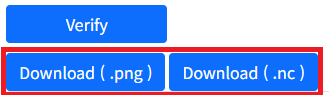
If you download the image file using the Download (.png) button on the screen above, the verification results are saved as a compressed file. Unzipping the file reveals the image file as shown below.
(Figure 1-7-10) Downloaded Image Files
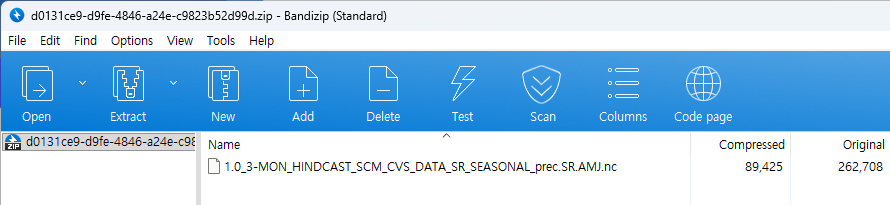
Clicking the Download (.nc) button allows you to download NetCDF files for the same verification results, and the result is as shown below.
(Figure 1-7-11) Downloaded NetCDF Files
When downloading verification results using the Download button on the screen where the My Jobs menu is selected, you can confirm that image files and NetCDF files are included together.
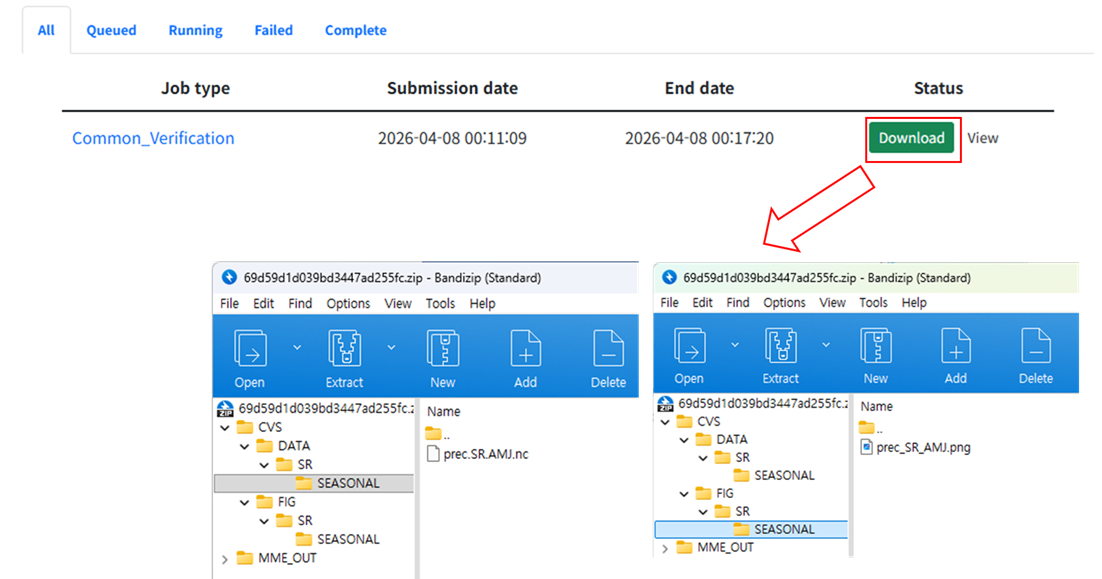
(Figure 1-7-12) Result of File Download using Download Button on My Jobs Page
I. Easy Guide to CLIK
Downscale Tutorial Link
This section explains how to register observation information to be used in the Downscale menu and how to generate and check downscale data using the registered observation information.
A. Login
Log in to the CLIK (refer to "Login into CLIK"). If you are already logged in, you do not need to proceed further.

(Figure 1-8-1) Login
Enter ID and Password to complete login.

(Figure 1-8-2) Enter Registered ID and Password
B. Select Processing > Downscale Menu
Select the 'Downscale' menu, a submenu of the 'Processing' menu, as shown in the figure below.

(Figure 1-8-3) Select Downscale Menu
C. Select Observation Information
Observation values at observation stations are required for downscale execution. Accordingly, public observation data is registered and provided for users to use, and a function for users to directly input and edit observation data is also provided.
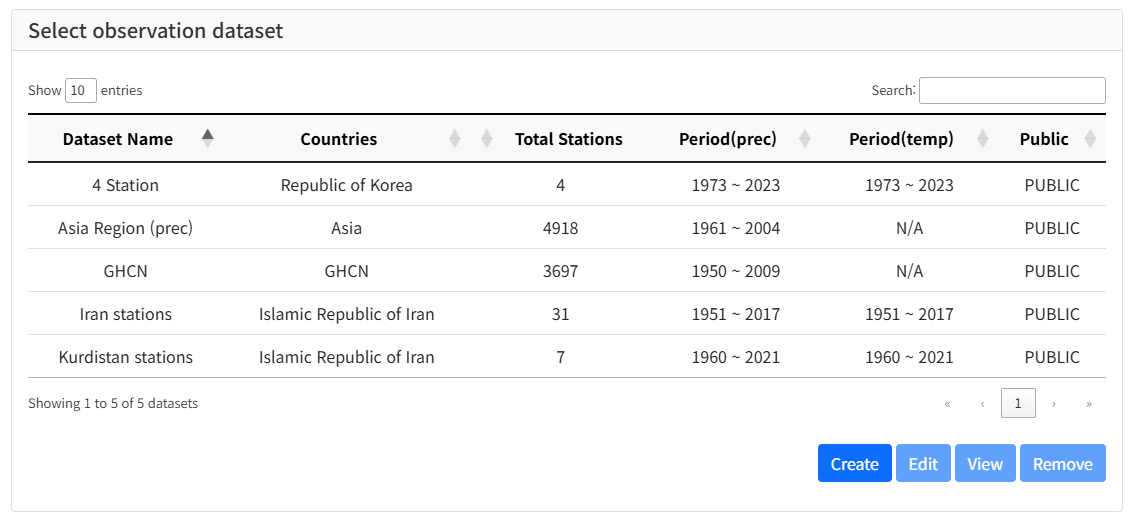
(Figure 1-8-4) Observation Data List
Users can select existing registered observation data to execute downscale, or click the 'Create' button to register and use their own observation data. However, here we will generate downscale data using already registered public observation data. When the user selects '4 Station' observation data from the list, the location of the observation station is displayed on the map as shown below. Pressing the Shift key and the left mouse button and dragging on the map selects observation stations within that area. After selecting one desired observation station (Daegu, 143 Station ID) among the selected observation stations, clicking the 'Input Downscale Job' button allows you to input the downscale job.

(Figure 1-8-5) Select Observation Station
D. Input Downscale Job
When you select an observation station and request downscale job input, a GUI where you can input execution conditions as shown below is displayed.
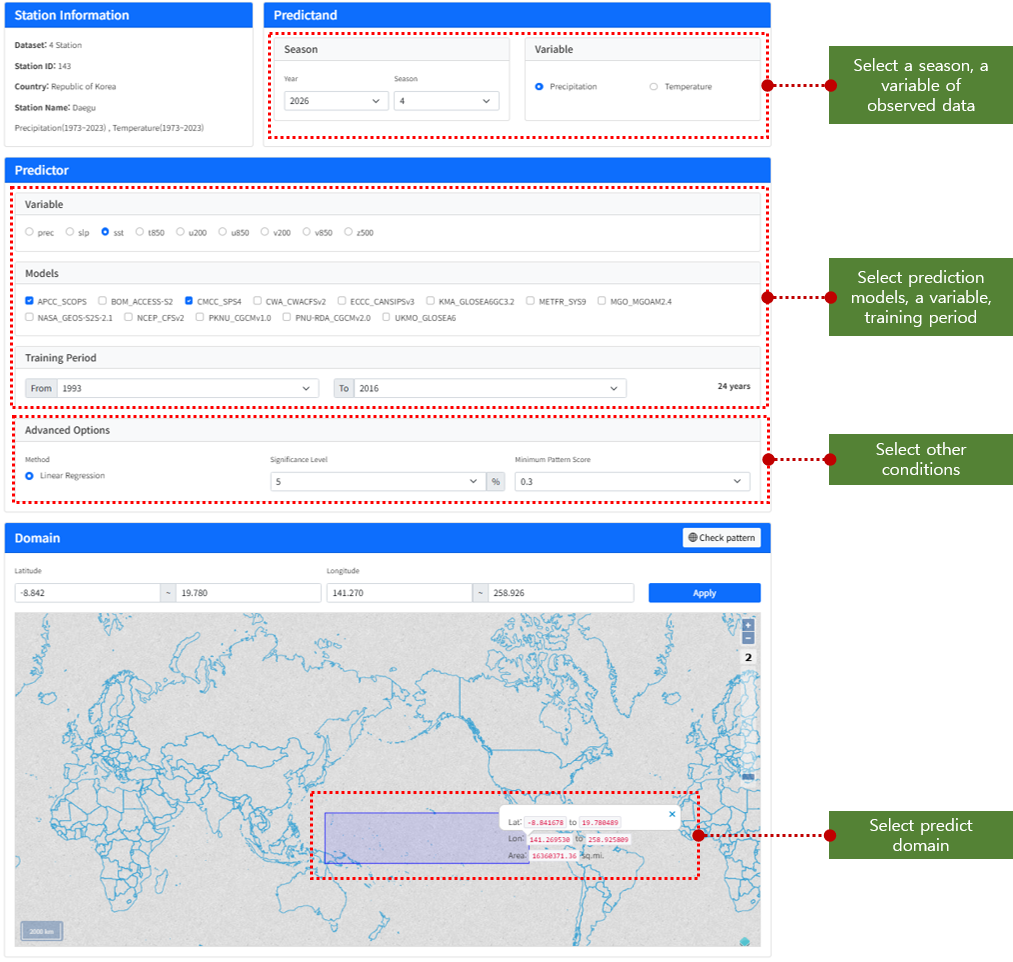
(Figure 1-8-6) Downscale Job Input Screen
The GUI is divided into a total of 4 parts. The 'Station information' part displays the observation station information selected by the user. In the 'Predictand' part, the user selects the downscale season (April 2026) and the observation variable (Precipitation). In the 'Predictor' part, prediction information is selected. Select the variable (sstc select APCC_SCOPS and CMCC_SPS4 models from the model list, and select the Training period. The 'Advanced Options' part has default values selected, and can be changed if desired. Generally, you can select the default values as they are.
In the 'Domain' part, select the predictor domain. You can select the area by dragging on the map while pressing the Shift key and the left mouse button, or input directly into the GUI (Latitude –8.842~19.780 / Longitude 141.270~258.926). At this time, a correlation map is provided to help with area selection. Clicking the 'Check pattern' button displays the correlation map. Users can refer to the correlation map when selecting the area. When selection is complete, clicking the 'Downscale' button executes the downscale job.

(Figure 1-8-7) Correlation map
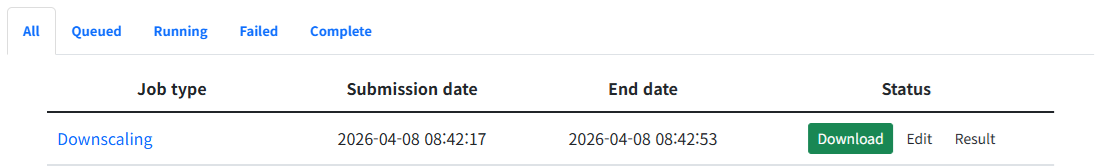
E. Check Downscale Job Execution Results
Downscale job results can be checked in the 'My Jobs' menu. If the job is successful, 'Download', 'Edit', and 'Result' buttons are displayed as shown below.
(Figure 1-8-8) Downscale Result Screen
Selecting the 'Download' button downloads the execution result file. Selecting the 'Edit' button displays the execution conditions input by the user. You can adjust the execution conditions and request the job again. Selecting the 'Result' button displays the downscale execution result. The execution conditions input by the user are displayed at the top as shown in the figure below.
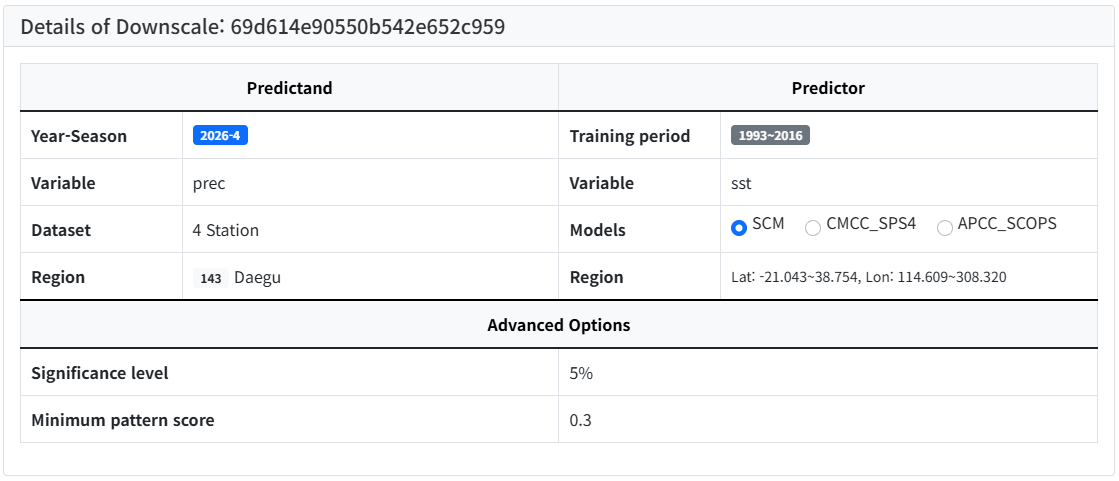
(Figure 1-8-9) Downscale Execution Result ??User Input Execution Conditions
When the user selects a desired list from the model list, the result as shown in the figure below is displayed.
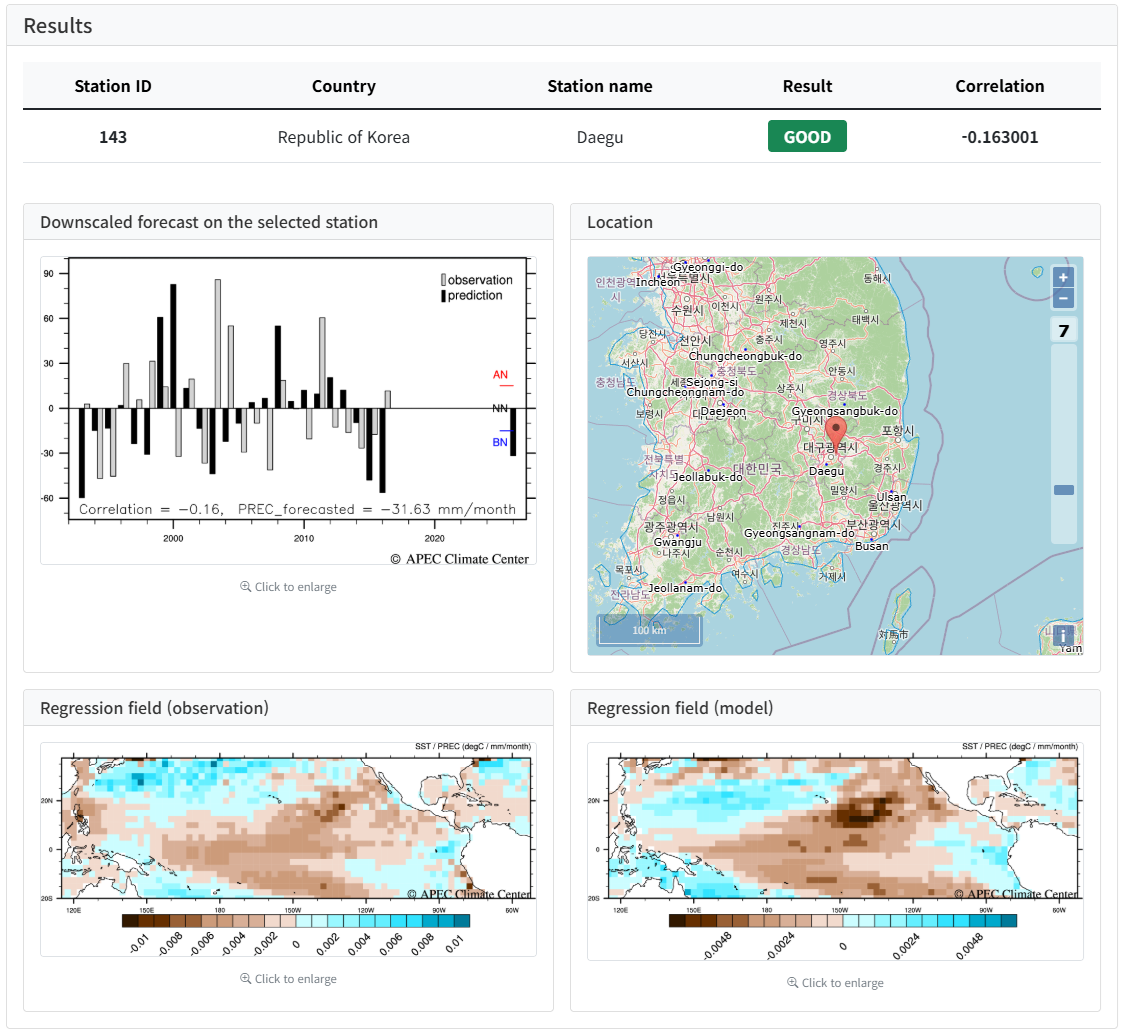
(Figure 1-8-10) Downscale Execution Result
I. Easy Guide to CLIK
Clipping Tutorial Link
This section explains how to extract data for the East Asia region from the April 2021 MME-3MON dataset.
A. Login
Log in to the CLIK (refer to "Login into CLIK"). If you are already logged in, you do not need to proceed further.
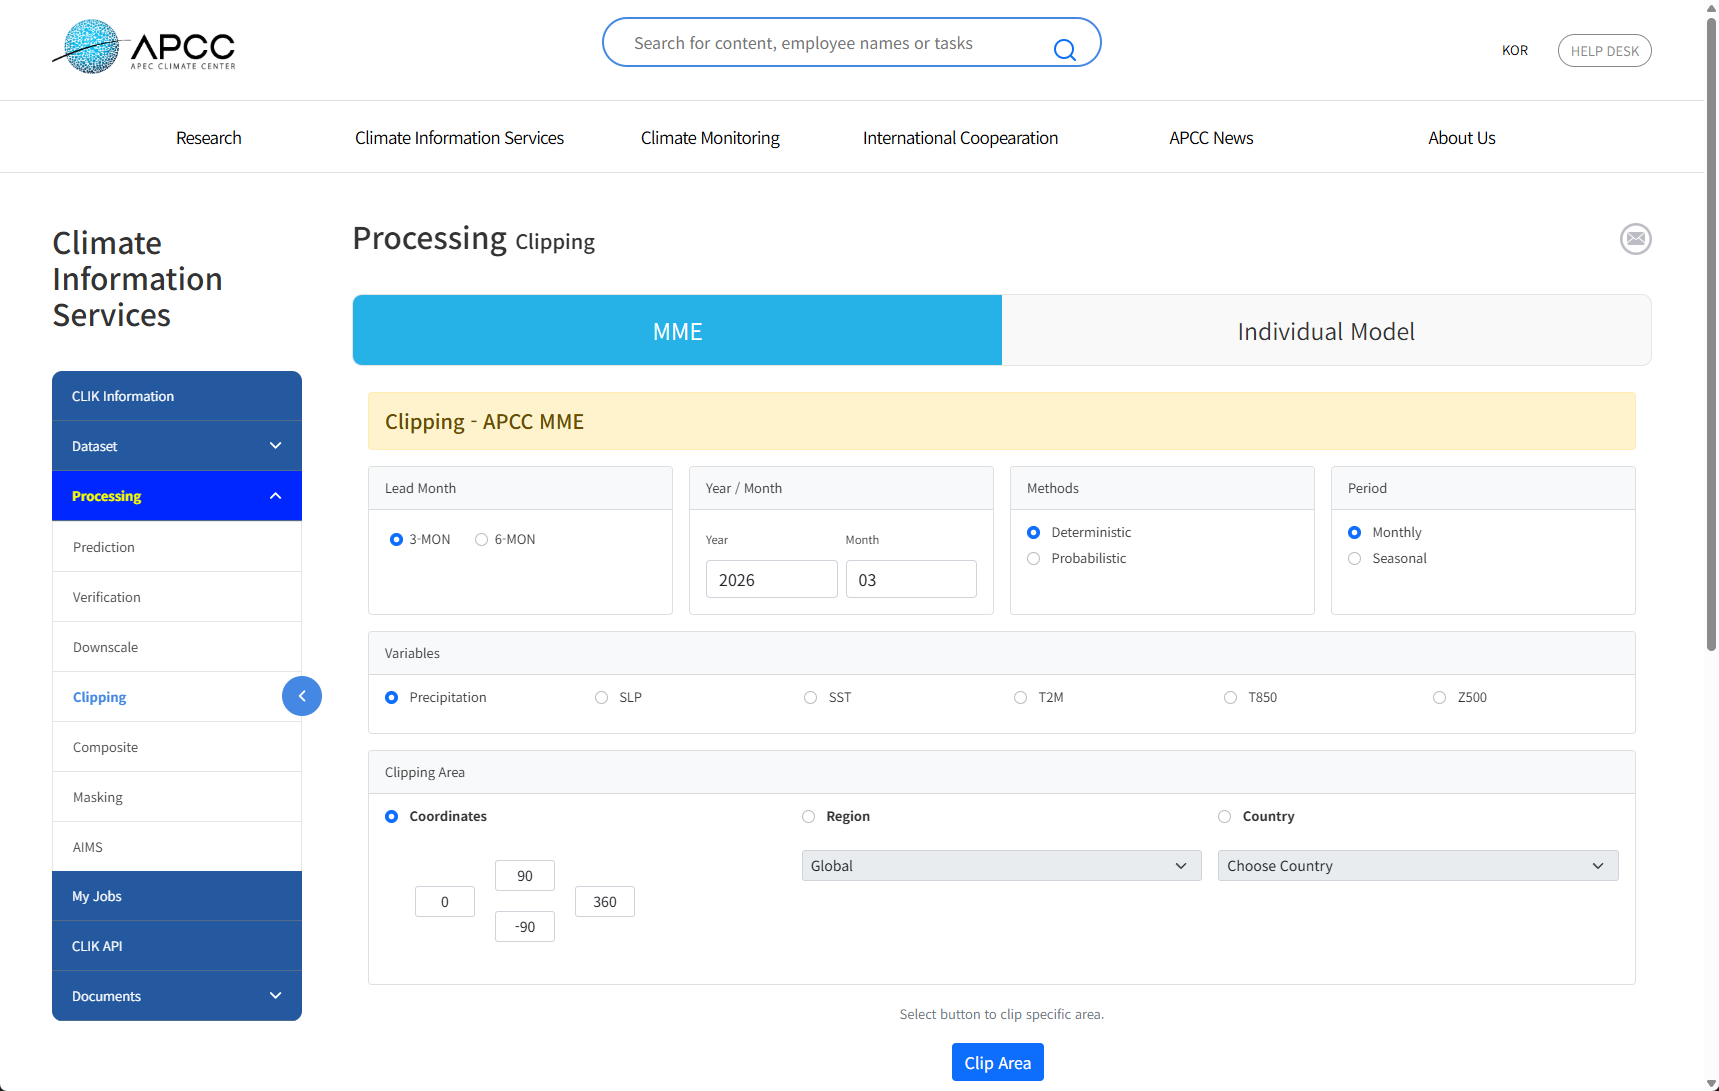
B. Select Processing > Clipping Menu
Select 'Clipping' from the 'Processing' menu to go to the data extraction service page. (The data extraction service is activated only when logged in.)
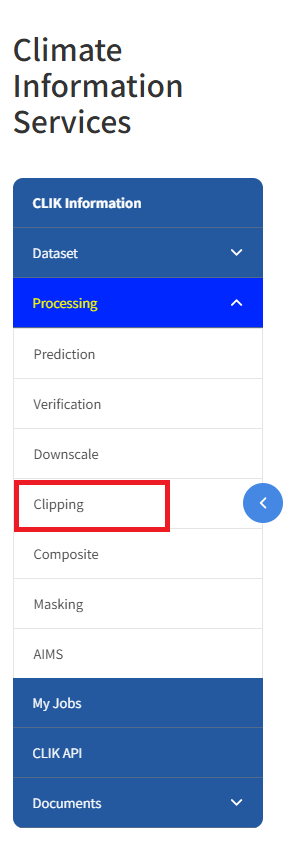
(Figure 1-9-1) Select Clipping Menu
C. Select Options (Variable, Lead Month, Method, Issued, Region)
For extracting MME data for the East Asia region, select Precipitation for the variable, 3-month lead time, and Monthly Deterministic prediction data (Deterministic_Monthly). Set the issue time and region to April 2021 and East Asia. The options on the actual screen are as follows.

(Figure 1-9-2) Select Clipping Options
To extract precipitation for the East Asia region
for April 2021, MME 3-month lead time, select the options as shown in
the figure above.
- Lead Time : 3-MON (3 months)
- Year/Month : April 2021
- Method : Deterministic
- Period : Monthly
- Variable : prec (Precipitation)
- Clipping Area (Region) : East Asia
D. Check Clipping Results
Clicking the 'Data Plot' button on the screen above allows you to check the 3-month prediction data extracted only for the East Asia region.
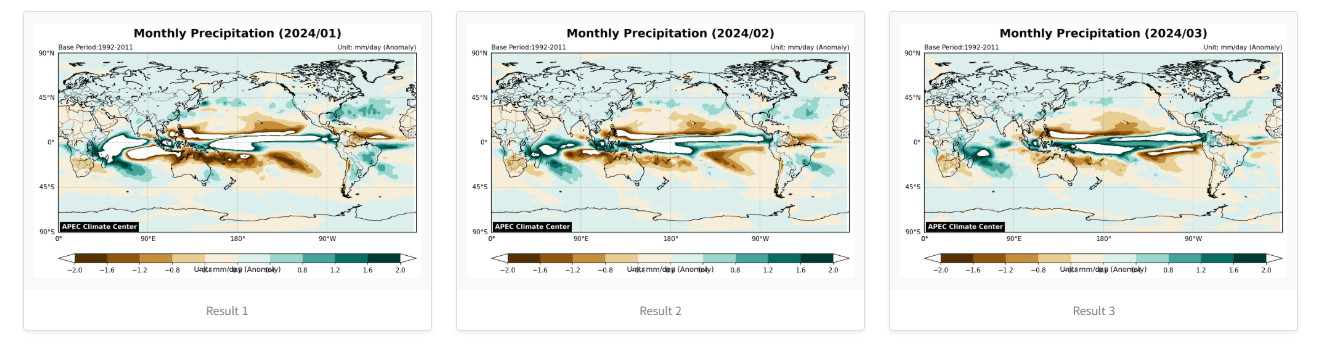
(Figure 1-9-3) Extracted Data Result for East Asia Region (3 months)
E. Download Image Results
Clicking on the result file allows you to open the original file of the image. You can save the result as a .png file by right-clicking on this image and selecting 'Save Image'.
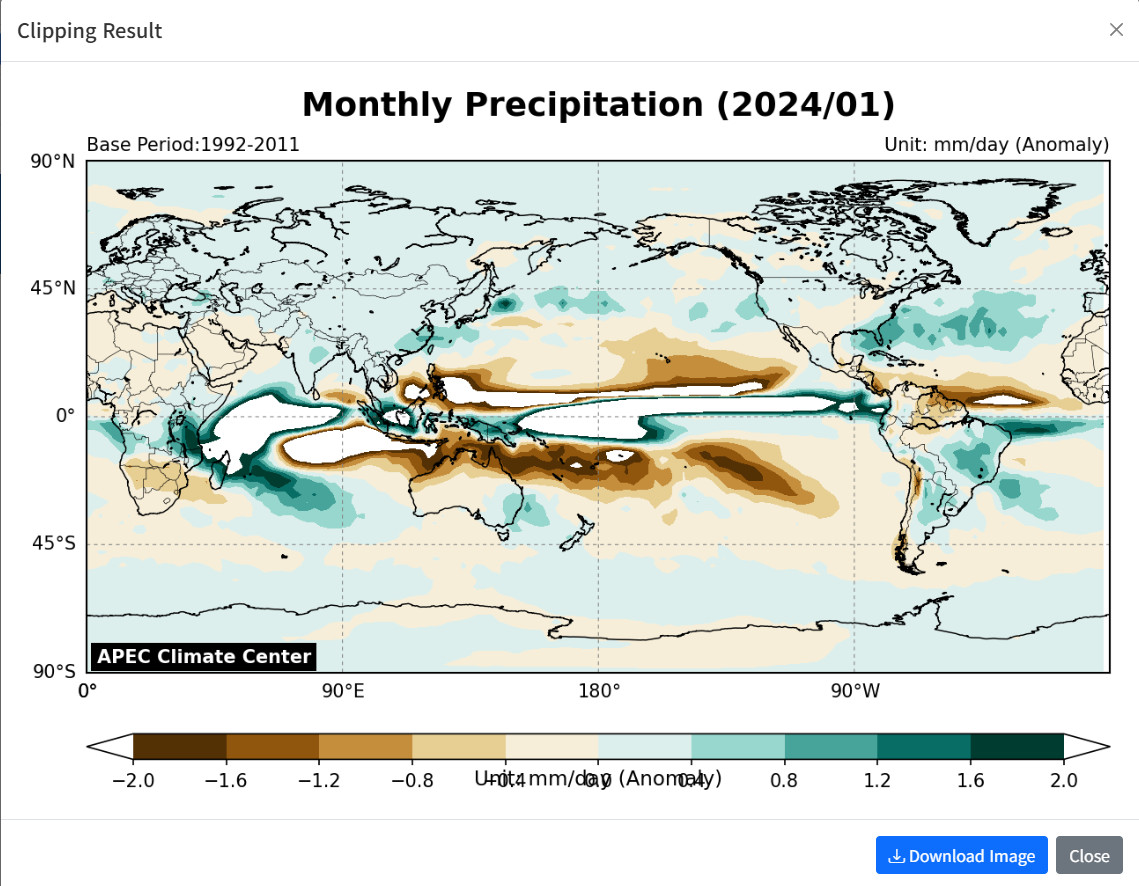
(Figure 1-9-4) Check Original Image File by Zooming In
II. Introduction to CLIK
Definition of CLIK
A. What is CLIK?
CLIK (CLimate Information toolKit) was developed by APCC in 2008 to provide online climate prediction information services for countries that do not have climate prediction technology or infrastructure, such as developing countries. This service provides APCC MME prediction services and statistical downscaling services. Recently, it has been redeveloped as a web service applying platform technology as "CLIK" (www.apcc21.org/clik) to expand the service provision area.
CLIK focuses on climate data services that allow users to download climate data produced and collected by APCC in various ways. It provides APCC Multi-Model Ensemble (MME) prediction data, monitoring and prediction information of Boreal Summer IntraSeasonal Oscillation (BSISO) indices, and some Coupled Model Intercomparison Project Phase 5 (CMIP5) data divided by region. Users can select and download desired data through the web page or download data directly to research equipment using data transfer protocols such as wget. Also, users familiar with programming languages can download and use data through Open API in their programs.
Currently, in addition to climate data services, CLIK also offers user-customized seasonal prediction and verification services based on individual model data, and data processing services such as Clipping and Composite of seasonal prediction data.
B. System Requirements
CLIK is a web service based on a multi-hybrid cloud platform. To use this service, a modern browser such as Chrome, Safari, Edge, Firefox, or IE (Internet Explorer) 11 or higher is required. CLIK is optimized for modern browsers and is built based on HTML5 and CSS3, so some functions may not work properly in IE 9 or lower.
Users of IE 9 or lower are recommended to use other browsers such as Chrome. Chrome web browser can be downloaded from https://www.google.com/chrome/. For installation of various applications for optimal use of the CLIK, please refer to IV. Appendix of this tutorial.
II. Introduction to CLIK
C. How to Sign Up
To use APCC climate information services, you must first sign up through the APCC User Integrated Authentication System (https://sso.apcc21.org). Through user registration, you can freely use all services currently provided by APCC, such as the APCC main website, CLIK, and Help Desk.
(Figure 2-3-1) Sign Up via APCC SSO System

(Figure 2-3-2) Sign Up via CLIK
Users can sign up by accessing the APCC CLIK website (https://www.apcc21.org/clik) or the User Integrated Authentication System website (https://sso.apcc21.org). Members who have already signed up can also use the 'Get Password' or 'Get ID' functions if they have lost their ID or password. Sign up is available via the 'Join Us' button for general membership, or through Google, Facebook, Naver, or Kakao.

(Figure 2-3-3) Privacy Policy and Lookup Existing Registration
When you click the initial Sign Up button, a screen confirming user consent along with the privacy policy explanation appears as shown in the figure above.
(Figure 2-3-4) Enter Sign Up Information
Enter the user ID you want to register, and it will automatically check for duplicates. The password also automatically checks the password creation rules (combination of 3 types: numbers, letters, special characters, or 8 digits or more). Then, register essential information (marked with *, name, email, etc.) and general information, and click the Send button to complete registration.
(Figure 2-3-5) Sign Up Completion Popup Message
When registration is completed as shown in the figure above, a verification email is sent to the registered email address. You will proceed with account activation through the link in the verification email. Once account activation is complete, you can use all APCC services normally. (If you do not receive the verification email, it may be treated as spam, so checking the spam folder is recommended.)
Also, if you lose your ID or password, you can access the APCC SSO website (https://sso.apcc21.org) and click the 'Forgot your Password or ID?' button to check your registered ID or receive a temporary password to replace the lost password.
II. Introduction to CLIK
D. How to Contact
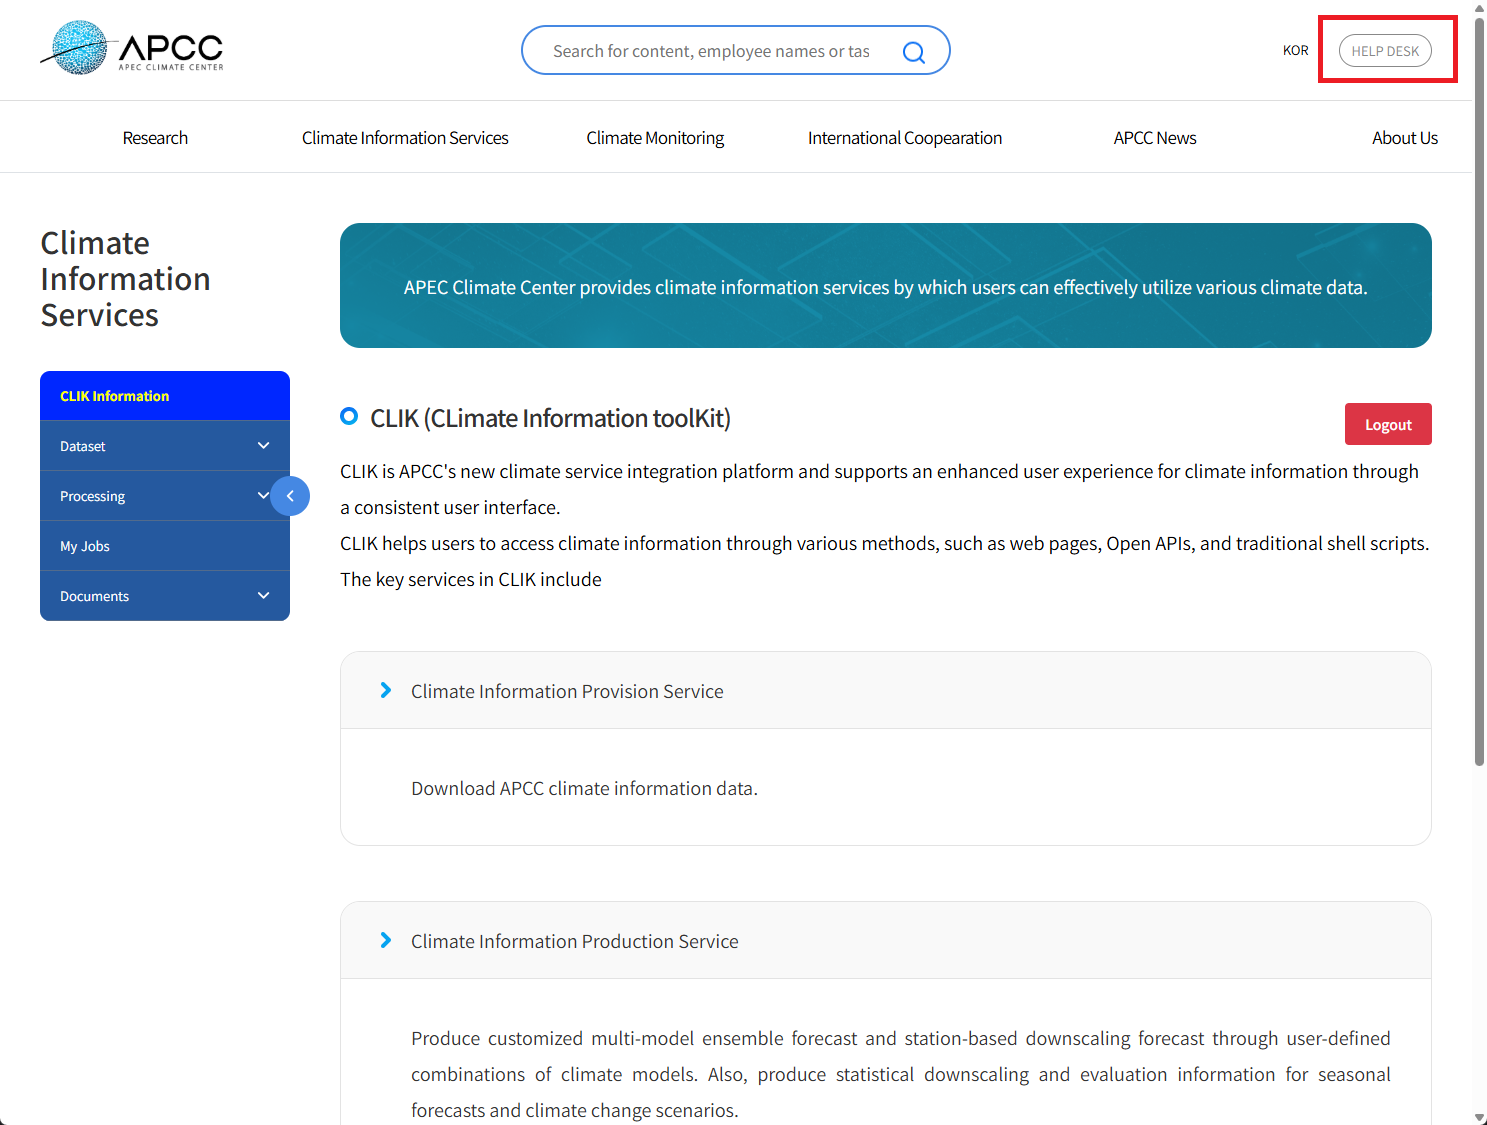
APCC always works to provide better climate information for the Asia-Pacific region. We focus on making our services easy to use and meeting your needs. Since 2020, we have been running the Online Help Desk Service to collect and manage your feedback in real-time.
To use the Online Help Desk Service, please visit the main APCC website and click the "Help Desk" menu button as shown in the image below. This will take you directly to the Online Help Desk Service page.
(Figure 2-4-1) Help Desk button on the APCC website
Through the Online Help Desk Service, users can create a Ticket to send feedback or ask questions. As shown in the image below, you can create a new ticket by clicking the "Create Ticket" button at the bottom right.
(Figure 2-4-2) Initial screen of the Online Help Desk Service
On the Online Help Desk Service screen, you can contact an APCC staff member by entering a "Title" for your ticket and your inquiry in the "Text" field. You can also use the "Select attachment" link in the center of the screen to attach images or other files.
(Figure 2-4-3) Creating a new ticket in the Online Help Desk Service
Once created, your ticket will appear in a chat-style format on the service page. The main screen shows your questions and the administrator's answers in a chat interface.
II. Introduction to CLIK
E. Purpose of CLIK
APCC develops and services various climate information services based on user needs to strengthen the utilization of climate information in the Asia-Pacific region. We provide MME seasonal prediction and verification results through the main website, and have operated ADSS (APCC Data Service System) to provide climate data in digital formats that users can directly download and use. Also, since 2008, we have been operating CLIK (CLimate Information toolKit), a user-customized seasonal prediction and downscaling service, CLIPs (CLimate Information Processing system), a service for climate data processing, and OpenWPS, a service that extracts masking information based on spatial information.
We are continuously improving APCC climate information services that provide climate data provision, processing, prediction, and verification information to expand convenience and usability, but there were limitations in improvement due to lack of scalability, efficiency, compatibility, and stability of the traditional IT environment. For example, the existing climate data service ADSS was a traditional service structured around FTP, which had limitations in improving it to reflect the latest User Experience (UX), including the inconvenience of users having to select and download individual files.
Accordingly, APCC is gradually integrating climate information services into a platform and expanding the platform service, and is promoting improvement of functions and new development reflecting the opinions of domestic and international users. In 2019, we developed a data-centric service platform to replace the existing climate data provision service (ADSS), and for gradual integration, we built a climate data provision service platform including user-customized seasonal prediction and verification information production service of the online climate information application tool (CLIK) and climate data processing service in 2020.
In 2021, we further platformized CLIK's downscaling technique and promoted the integration of most climate information services actually provided by APCC, such as data extraction using masking information. This is the primary completion of an innovative system transition that can increase system resource operation efficiency and achieve budget reduction effects, unlike tasks that build existing purpose-oriented climate information service systems. Also, it is a measure to flexibly respond through the usability of cloud technology to the integrated operation of scattered APCC climate information services and the increasing demand for climate information.
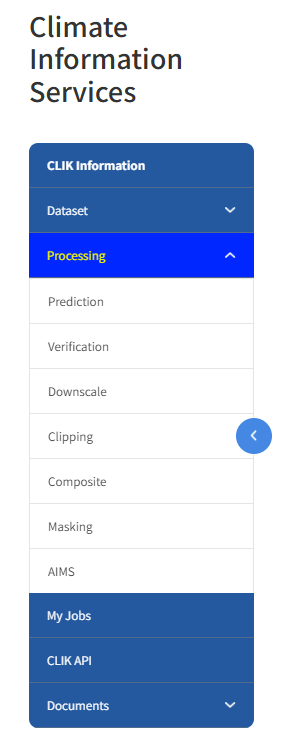
III. Structure of CLIK Menu
CLIK Menu
(Figure 3-1-1) CLIK Menu Structure
The menu of the CLIK climate service platform (https://www.apcc21.org/clik) consists of Dataset, Processing, CLIK API, Manual, and Member as shown in the figure above.
A. Dataset
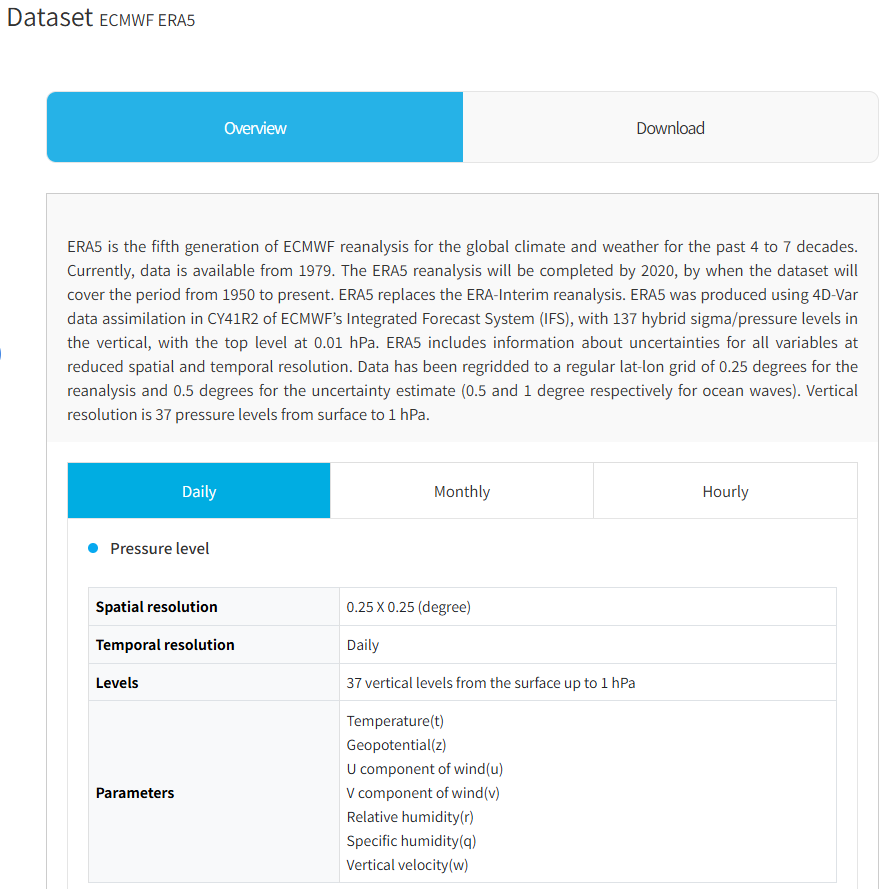
CLIK provides APCC seasonal prediction data, including Multi-Model Ensemble (MME), individual model data, and monitoring and prediction information for Boreal Summer Intraseasonal Oscillation (BSISO) indices. It also offers specific datasets from the Coupled Model Intercomparison Project Phase 5 (CMIP5) categorized by region. Notably, the service has been expanded to include the National Centers for Environmental Prediction (NCEP) and ECMWF Reanalysis v5 (ERA5) datasets to provide a more comprehensive range of climate information.
Each dataset is divided into Overview and Download sections. The Overview provides a detailed description of the data, while the Download section allows users to select and request their desired data parameters.
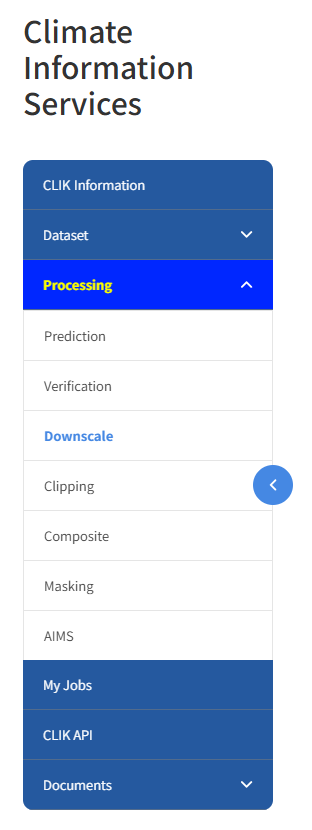
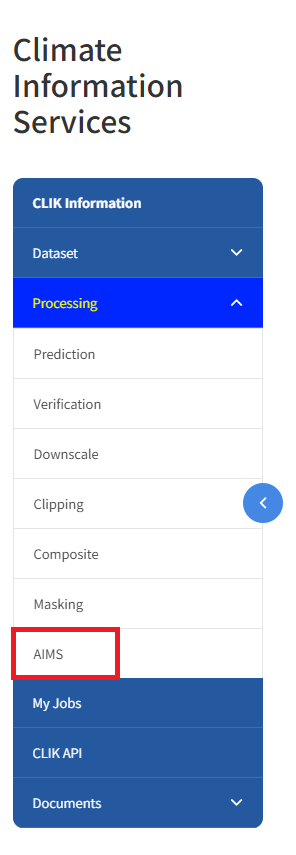
B. Processing
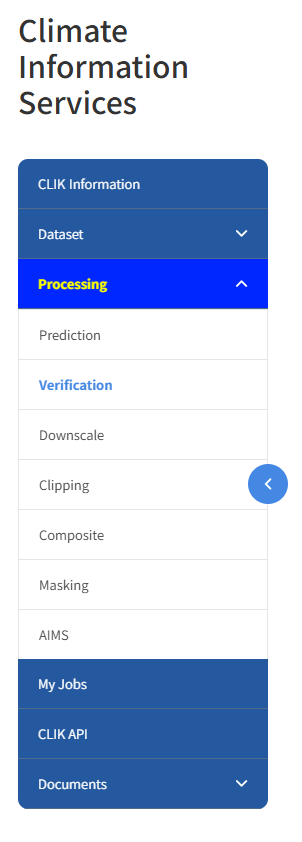
The Processing menu offers user-customized seasonal prediction and verification services, as well as specialized data processing functions including Downscale, Masking, Clipping, Composite, and AIMS (APCC Integrated Modeling Solution). These tools enable users to precisely process and tailor climate data to meet their specific research and operational requirements.
C. My Jobs
You can check the results of your requests in the "Request" section.
D. CLIK API
Calculates how users can insert data download codes into programs using the Open Application Programming Interface (Open API) service and provides available examples.
E. Documents
Provides manuals explaining the CLIK climate service platform in English.
III. Structure of CLIK Menu
Detailed Functions of CLIK
1. Dataset
A. MME-3MON Link
The MME-3MON menu provides 3-month seasonal prediction MME data. For detailed information about the data, please refer to the Methodology page.
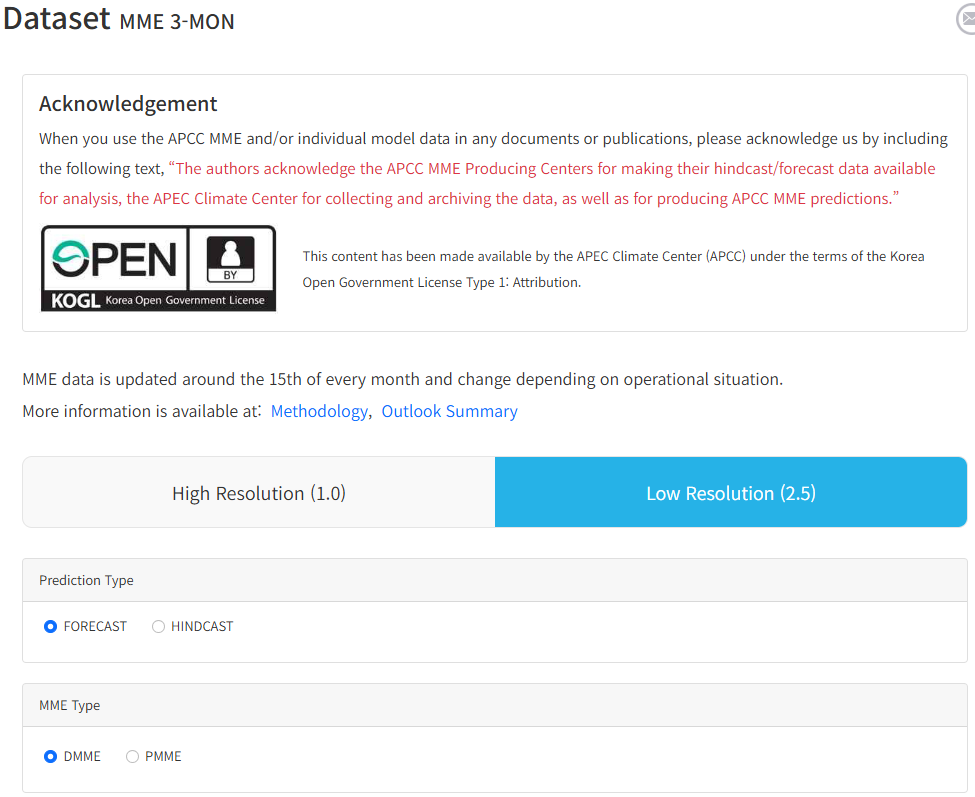
(Figure 3-2-1) MME Dataset Page
Users can request data using the following methods.
- Resolution: Select a resolution

(Figure 3-2-2) Select a Resolution
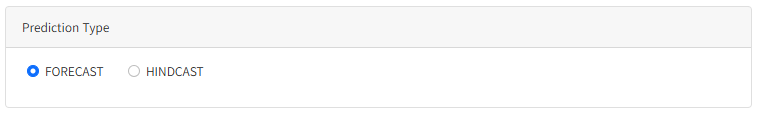
- Type: Select a prediction type
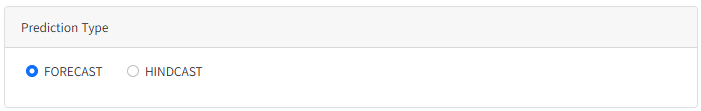
(Figure 3-2-3) Select a Prediction Type
- MME Type: Select a MME type
> DMME: Deterministic MME
> PMME: Probabilistic MME
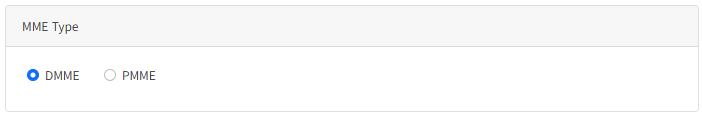
(Figure 3-2-4) Select a MME Type
- Variables: Select variables
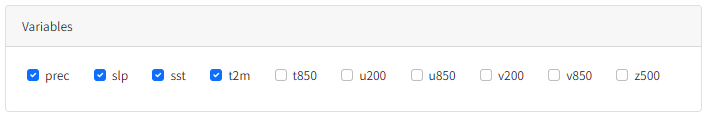
(Figure 3-2-5) Select MME Variables
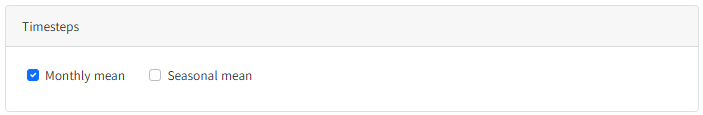
- Timestep: Select a data averaging timestep (Seasonal mean is the average of Monthly mean)
(Figure 3-2-6) Select a MME Timestep
- Date: Select seasons for data download (Selecting Year/Season in the
table selects the entire Year/Season at once)
> "Download latest season" button in
FORECAST:
Download all data for the last season of the selected MME type
> "Download last year" button in HINDCAST:
Download all data for the last year of the selected MME Type
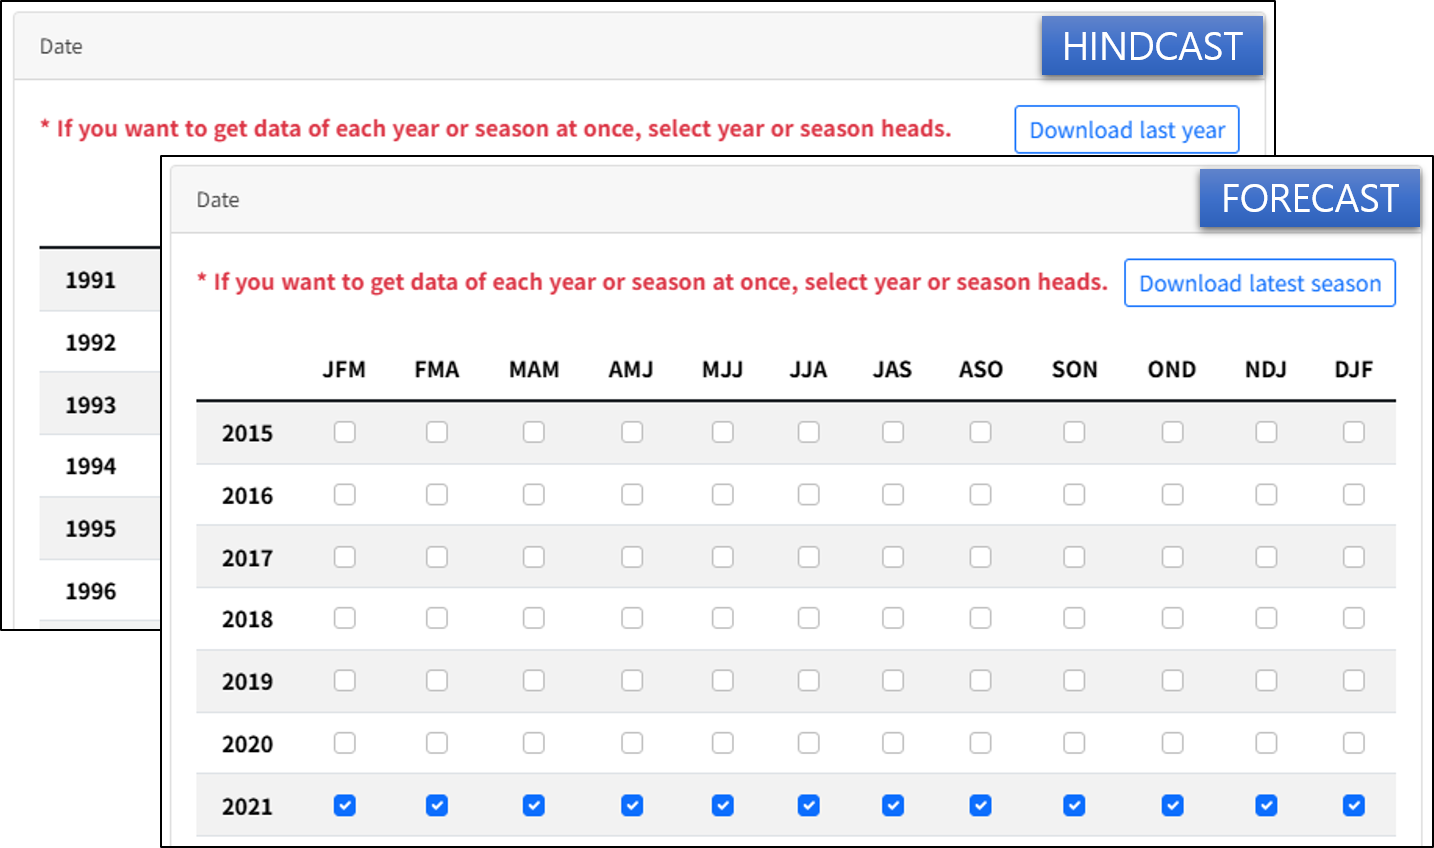
(Figure 3-2-7) Select Target Data Period
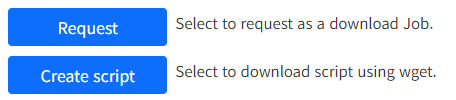
- Select "Request" or "Create script" button

(Figure 3-2-8) Request Data
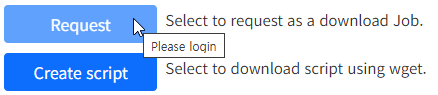
Selecting the "Request" button in the figure above registers a Job for data download. If the user is not logged in, the "Request" button is disabled as shown below.

(Figure 3-2-9) Request Button When Not Logged In
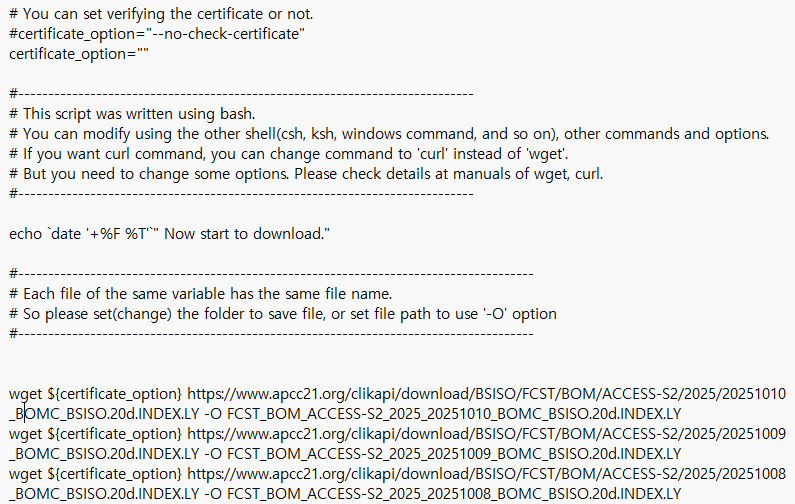
Unlike general low resolution MME data, high resolution MME data only provides a script service. The "Create script" button transfers a script that allows users to download data directly using the wget command on their local server or computer, and the script file (Linux system based) is downloaded immediately.
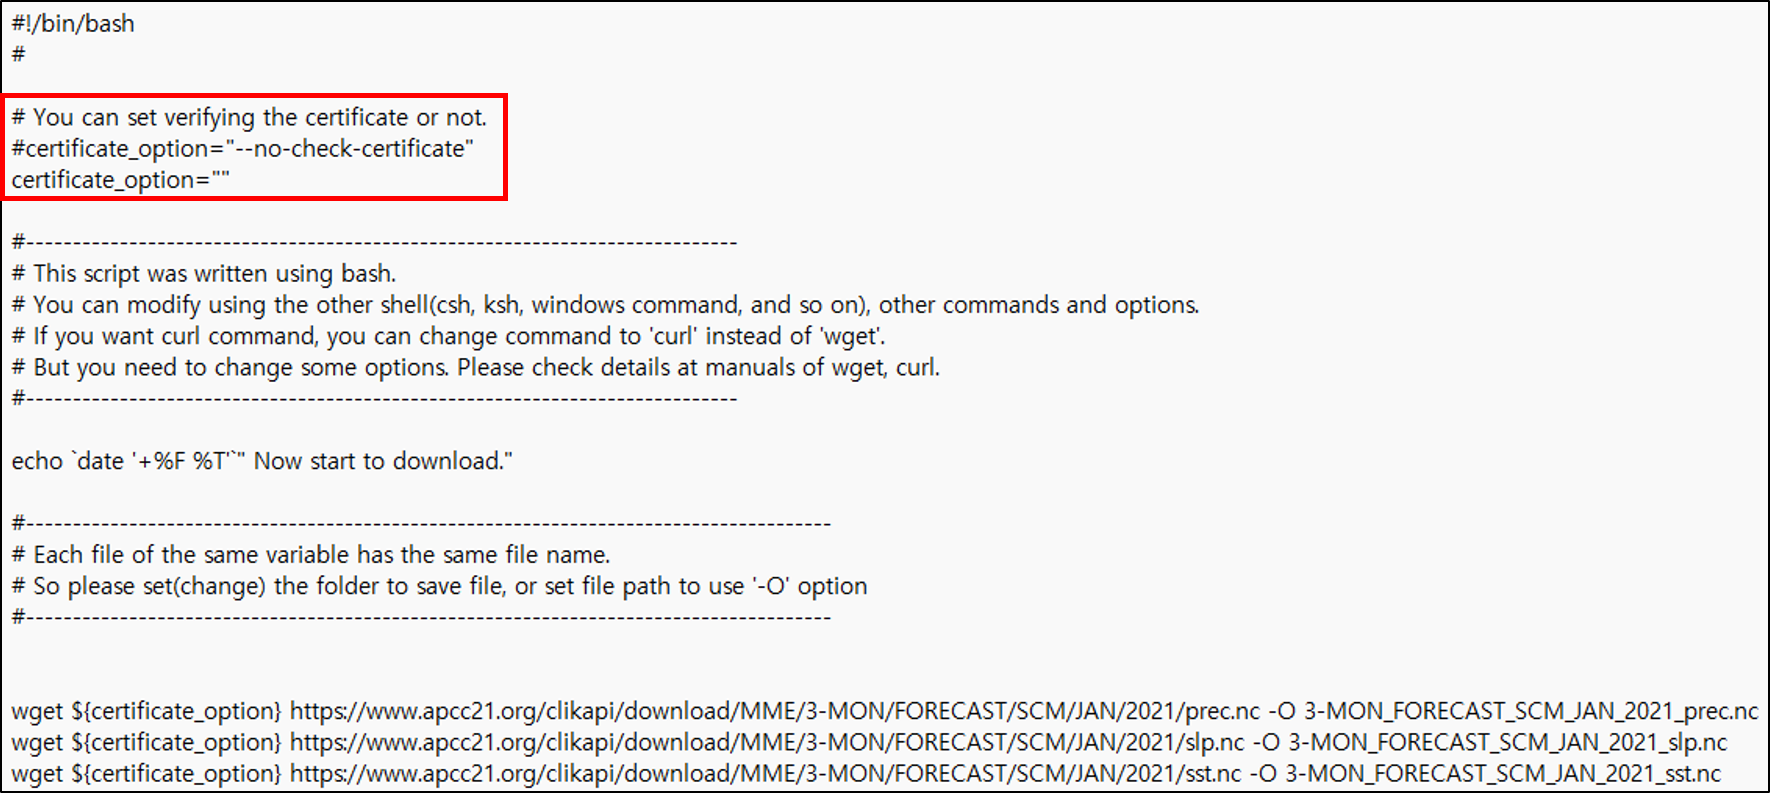
(Figure 3-2-10) Download Script Using wget
- certificate_option:
Set "--no-check-certificate" when the certificate used for https communication is not verified on the user's server or computer.
- "-O" option:
You can specify the location and filename of the file to be actually saved.
The URL for data download is constructed as shown in the table below. Values in brackets ("[ ]") in the table refer to the selection values below.
- Type: Select data type
> Lead Month: 3-MON (6-MON for 6-month
prediction data)
> Month: Abbreviation for each month such as
JAN, FEB
> Season: Values representing seasons such as
JFM (Jan Feb Mar), FMA (Feb Mar Apr) at the top of the Date table
[Table 1] MME Download URL
| Resolution | Period | URL |
|---|---|---|
| Low | Monthly Mean | https://www.apcc21.org/clikapi/download/MME/ [Lead Month] / [Prediction type] / [MME Type] / [Month] / [Year] / [Variable].nc |
| Low | Seasonal Mean | https://www.apcc21.org/clikapi/download/MME/ [Lead Month] / [Prediction type] / [MME Type] / [Month] / [Season] / [Year] / [Variable].nc |
| High | Monthly Mean | https://www.apcc21.org/clikapi/download/MME-HRES/ [Lead Month] / [Prediction type] / [MME Type] / [Month] / [Year] / [Variable].nc |
| High | Seasonal Mean | https://www.apcc21.org/clikapi/download/MME-HRES/ [Lead Month] / [Prediction type] / [MME Type] / [Month] / [Season] / [Year] / [Variable].nc |
If you use individual model and Multi-Model Ensemble (MME) data for
research, we request the following acknowledgement in your reports and
papers:
"The Multi-Model Ensemble data used in this research were collected and
reproduced by APCC based on hindcast/forecast data produced by APCC MME
Producing Centres (PCs),
and we thank APEC Climate Center for producing/providing the data."
B. MME-6MON Link
The MME-6MON menu provides 6-month seasonal prediction MME data. The download method for 6-month MME forecast is the same as for 3-month forecast.
C. MME-MODEL Link
The MME-MODEL menu provides MME individual model data. For description of the data, please refer to the Methodology page. Users can request download as follows.
- Resolution: Select a resolution

(Figure 3-2-11) Select a Resolution
- Type: Select a prediction type
(Figure 3-2-12) Select a Prediction Type
- Year: Select data production year if the prediction type is HINDCAST
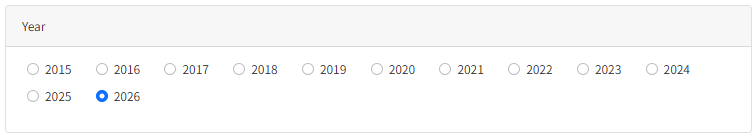
(Figure 3-2-13) Select HINDCAST Production Year
- Institute: Select a MME model provider
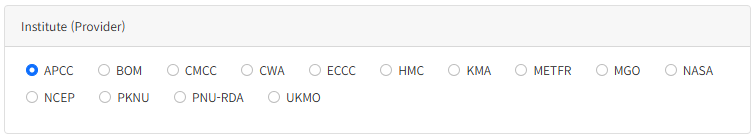
(Figure 3-2-14) Select a MME Model Provider
- Model: Select a climate model
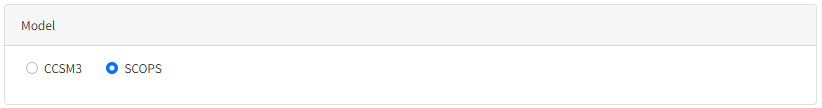
(Figure 3-2-15) Select a MME Participating Model
- Variables: Select variables
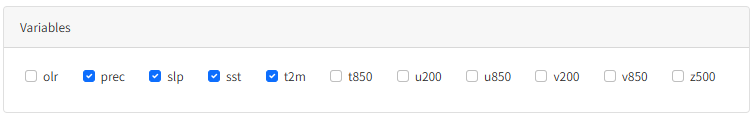
(Figure 3-2-16) Select Variables
- Date: Select period for data download (Selecting Year/Month in table selects entire Year/Month at once)
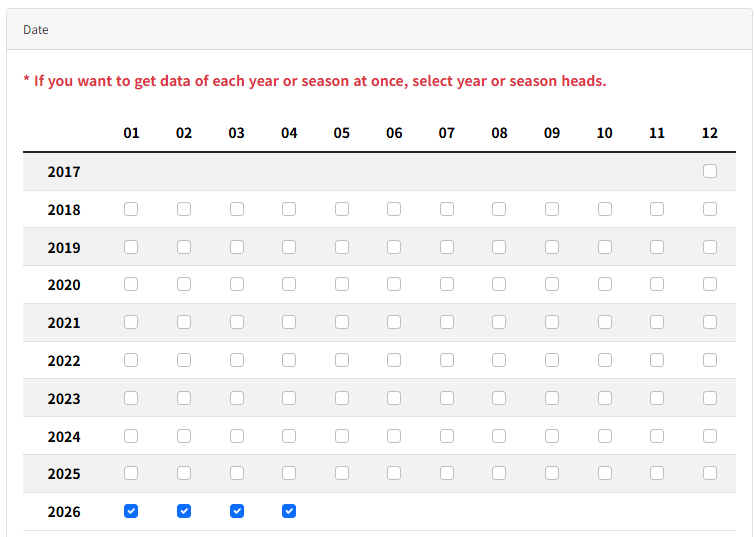
(Figure 3-2-17) Select Download Period
- Select "Request" or "Create script" button

(Figure 3-2-18) Request Data
Selecting the "Request" button registers a Job for data download. If the user is not logged in, the "Request" button is disabled as shown below.

(Figure 3-2-19) Request Button When Not Logged In
Unlike general low resolution MME data, high resolution MME data only provides a script service. The "Create script" button transfers a script that allows users to download data directly using the wget command on their local server or computer, and the script (Linux system based) file is downloaded immediately.
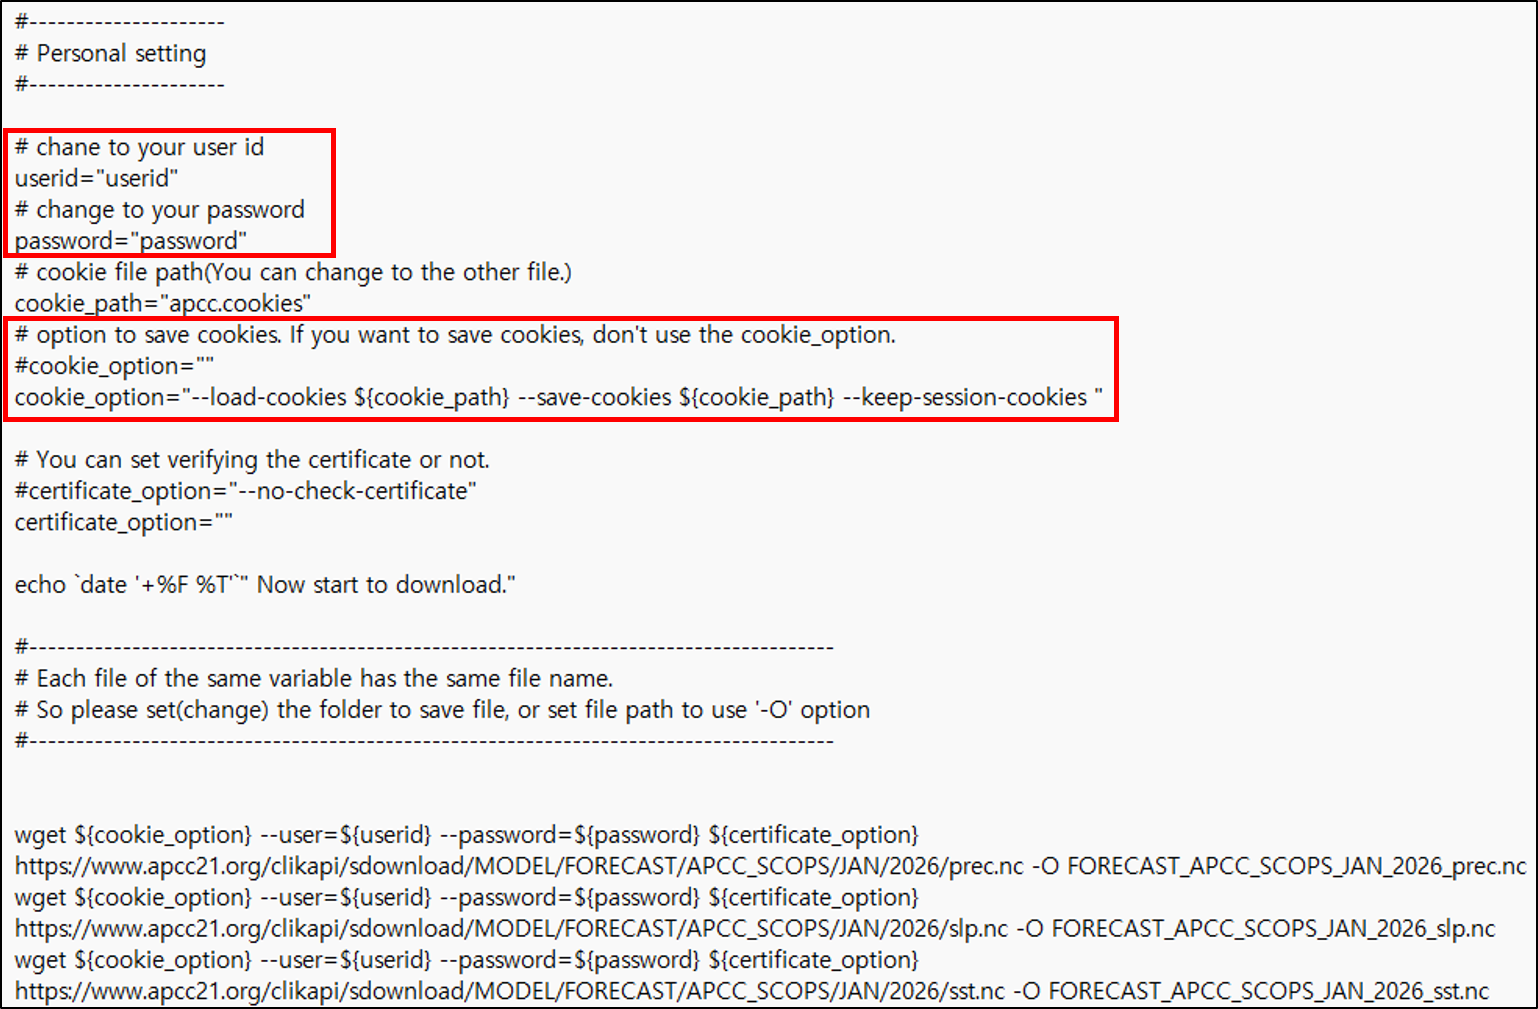
(Figure 3-2-20) Model Data Download Script Using wget
To download data using the script, users need to modify the script to fit their environment.
- userid, password: Enter your ID and password.
- cookie_option: If you do not want to save cookies from the website, leave the content of cookie_option empty.
If cookies are not saved, user authentication will be performed every time a data file is downloaded, which may delay data transmission.
- certificate_option: Set "--no-check-certificate" when the certificate used for https communication is not verified on the user's server or computer.
- "-O" option: You can specify the location and filename of the file to be actually saved.
The URL for data download is constructed as shown in
the table below. Values in brackets ("[ ]") in the table refer to the
selection values below.
> Lead Month: 3-MON (6-MON for 6-month
prediction data)
[Table 2] MME Model Download URL
| Resolution | Prediction type | URL |
|---|---|---|
| Low | FORECAST | https://www.apcc21.org/clikapi/sdownload/MODEL/FORECAST/ [Institute]_[Model] / [Month] / [Year] / [Variable].nc |
| Low | HINDCAST | https://www.apcc21.org/clikapi/sdownload/MODEL/HINDCAST[Hindcast Year] / [Institute]_[Model] / [Month] / [Year] / [Variable].nc |
| High | FORECAST | https://www.apcc21.org/clikapi/sdownload/MODEL-HRES/FORECAST/ [Institute]_[Model] / [Month] / [Year] / [Variable].nc |
| High | HINDCAST | https://www.apcc21.org/clikapi/sdownload/MODEL-HRES/HINDCAST[Hindcast Year] / [Institute]_[Model] / [Month] / [Year] / [Variable].nc |
If you use individual model and Multi-Model Ensemble (MME) data for
research, we request the following acknowledgement in your reports and
papers:
"The Multi-Model Ensemble data used in this research were collected and
reproduced by APCC based on hindcast/forecast data produced by APCC MME
Producing Centres (PCs),
and we thank APEC Climate Center for producing/providing the data."
D. BSISO Link
APCC BSISO (Boreal Summer Intraseasonal Oscillation) indices is produced between May and October, and some indices is updated daily. APCC provides prediction information (FORECAST) and monitoring information (MONITORING). Users can request prediction data download by selecting attributes such as data type, institute, and model as follows.
- Type: Select a data type
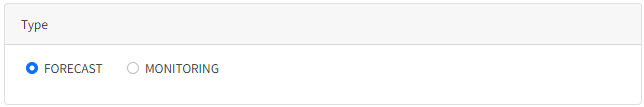
(Figure 3-2-21) Select a Data Type
- Institute: Select a data provider (FORECAST)
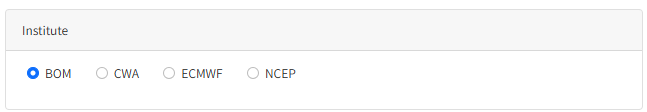
(Figure 3-2-22) Select a Data Provider
- Model: Select a model (FORECAST)
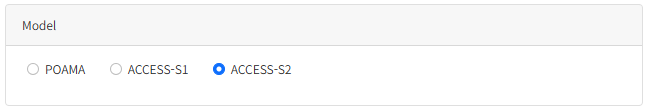
(Figure 3-2-23) Select a Model
- Date: Select download period (Year, Month) (FORECAST)
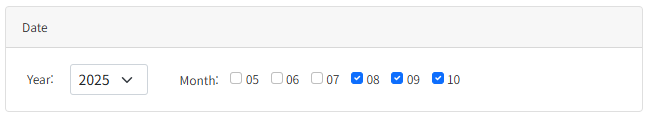
(Figure 3-2-24) Select Download Period
- Select Download Files
> Select "All" checkbox in FORECAST: Select all files in the list> Select filename: Download the file immediately
> "Download historical data" button in FORECAST: Download entire FORECAST data of the selected model (zip compressed) immediately
> Monitoring (MONITORING) data contains 1 year of data in one file.
> "Download all data" button in MONITORING: Download all MONITORING data immediately
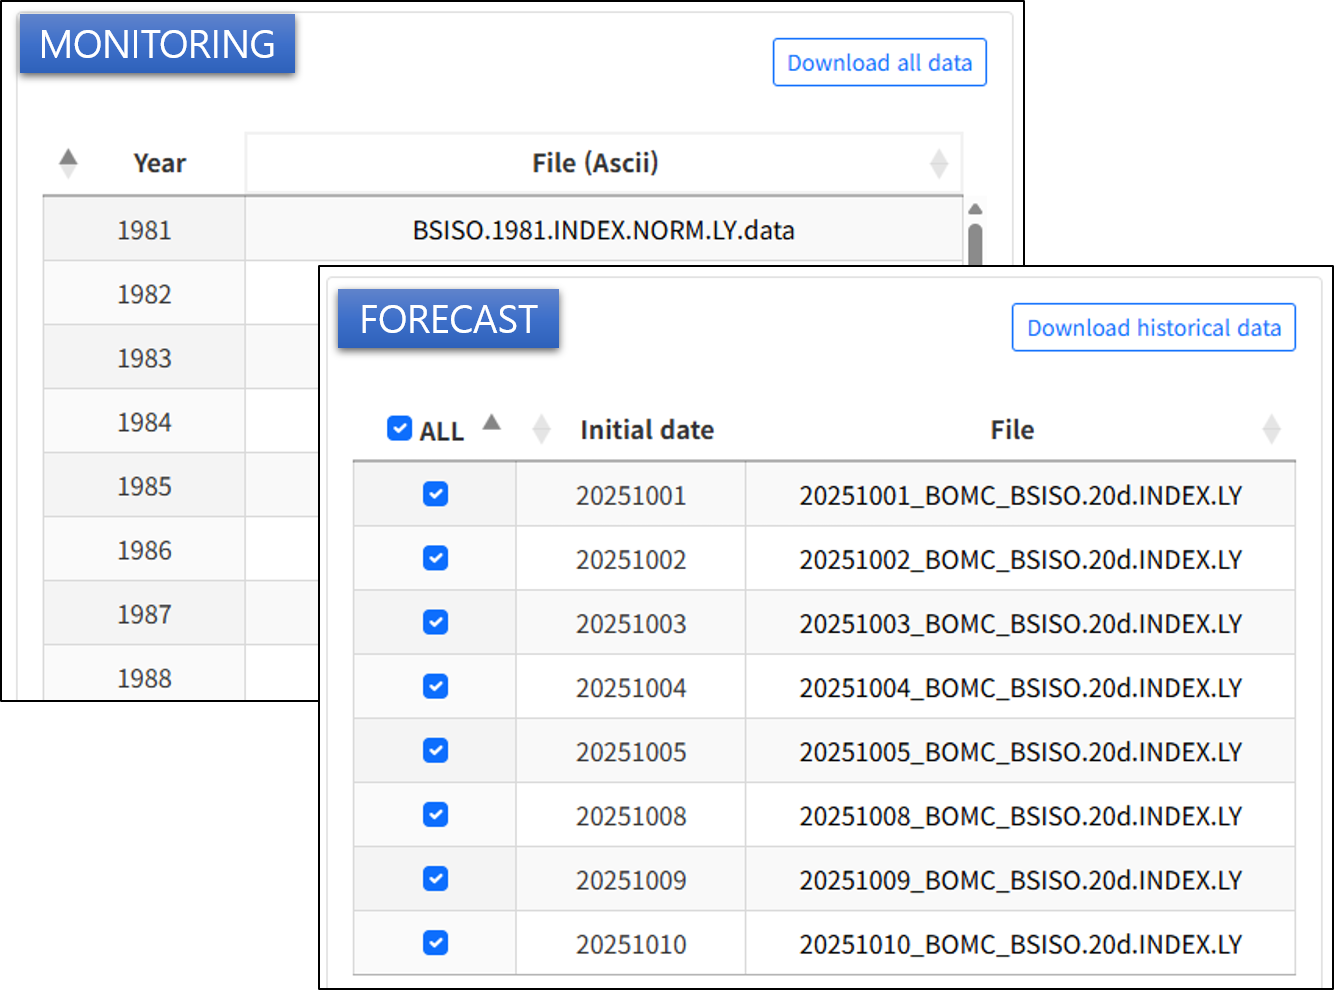
(Figure 3-2-25) Select Download Files
- Select "Request" or "Create script" button

(Figure 3-2-26) Request Data
Selecting the "Request" button registers a Job for data download. If the user is not logged in, the "Request" button is disabled as shown below.

(Figure 3-2-27) Request Button When Not Logged In
The "Create script" button transfers a script that allows users to download data directly using the wget command on their local server or computer, and the script (Linux system based) file is downloaded immediately.
(Figure 3-2-28) BSISO Data Download Script Using wget
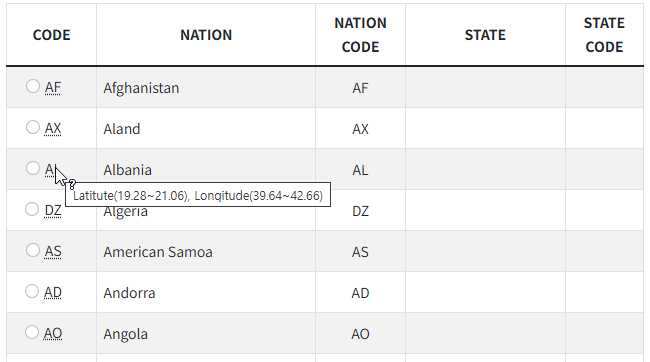
E. CMIP5 Link
In the CMIP5 page, you can select and request CMIP5 data clipped by region as follows. Hovering the mouse over the CODE of each region allows you to check the latitude and longitude values of that region. Countries provided by state due to their vast range are as follows.
[Select country or state to download]
- USA
- Russia
- China
- Canada
(Figure 3-2-29) CMIP5 Data Country List
- Select "Request" or "Create script" button
(Figure 3-2-30) Request Data
Selecting the "Request" button registers a Job for data download. If the user is not logged in, the "Request" button is disabled as shown below.
(Figure 3-2-31) Request Button When Not Logged In
The "Create script" button transfers a script that allows users to download data directly using the wget command on their local server or computer, and the script (Linux system based) file is downloaded immediately.
CMIP5 data can be downloaded without user authentication, so user settings and cookie settings are not required. The download URL for data is constructed as shown in the following table. Values in brackets ("[ ]") in the table are the CODE values from the CMIP5 data country list.
[Table 5] CMIP5 Download URL
| URL |
|---|
| https://www.apcc21.org/clikapi/download/CMIP5/cmip5_daily_[CODE].zip |
When you use other APCC data products in any documents or
publications,
please acknowledge us by including following text,
The authors acknowledge the APEC Climate Center for providing the
Clipped CMIP5”.
Note that you may have to insert citations or references for these
datasets,
following the original ‘how to cite dataset’ directions posted on the
original website for these datasets.
F. ERA5 Link
The ERA5 page guides you on how to download ERA5 reanalysis data from the European Centre for Medium-Range Weather Forecasts (ECMWF). ERA5 provided by CLIK is data collected and provided by APCC from the Copernicus Climate Change Service Data Store (CDS). For more details, please refer to the Overview tab shown in the figure below and the CDS website (https://cds.climate.copernicus.eu).
(Figure 3-2-32) ERA5 Overview Page
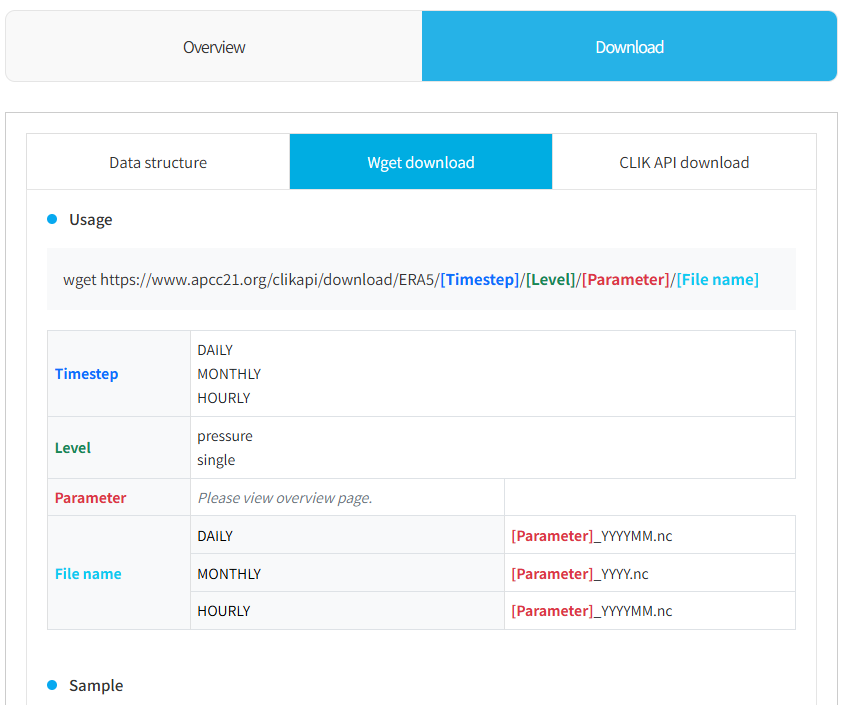
ERA5 reanalysis data consists of Daily (6-hour unit), Hourly, and Monthly data, and is provided classified by pressure (multiple level, single level). Details regarding temporal resolution (timestep), level, and variables of the data can be found in the Overview tab. CLIK provides ERA5 download services through two methods: wget and CLIK API. You can download data using wget as shown in the figure below, and the data storage structure can be confirmed in the Data structure of Download tab.
(Figure 3-2-33) How to Download ERA5 Reanalysis Data Using wget
Also, users can download data using CLIK API as shown in the following figure. Selecting Daily, Monthly, Hourly sample provides example codes that can be used for each temporal resolution.
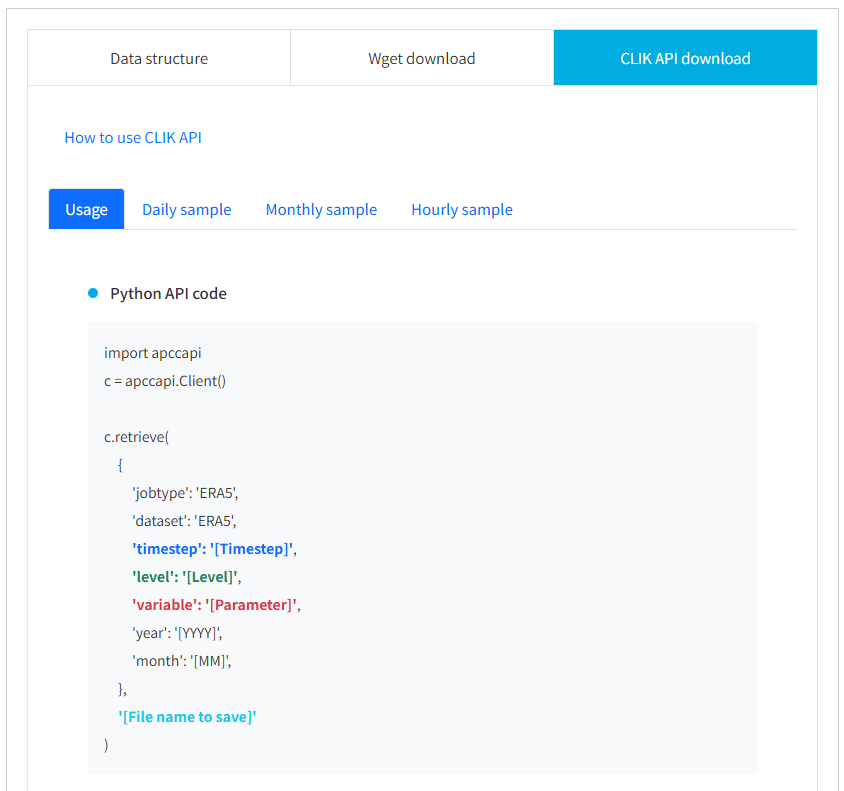
(Figure 3-2-34) How to Download ERA5 Reanalysis Data Using CLIK API
G. NCEP Reanalysis Link
The NCEP Reanalysis page guides you on how to
download NCEP1 and NCEP2 reanalysis data. Detailed description of NCEP data
is provided in the Overview tab of the NCEP Reanalysis page below.
For detailed information about the original data, please refer to the NCEP
Reanalysis 1 website
(https://psl.noaa.gov/data/gridded/data.ncep.reanalysis.html) and NCEP
Reanalysis 2 website
(https://psl.noaa.gov/data/gridded/data.ncep.reanalysis2.html).
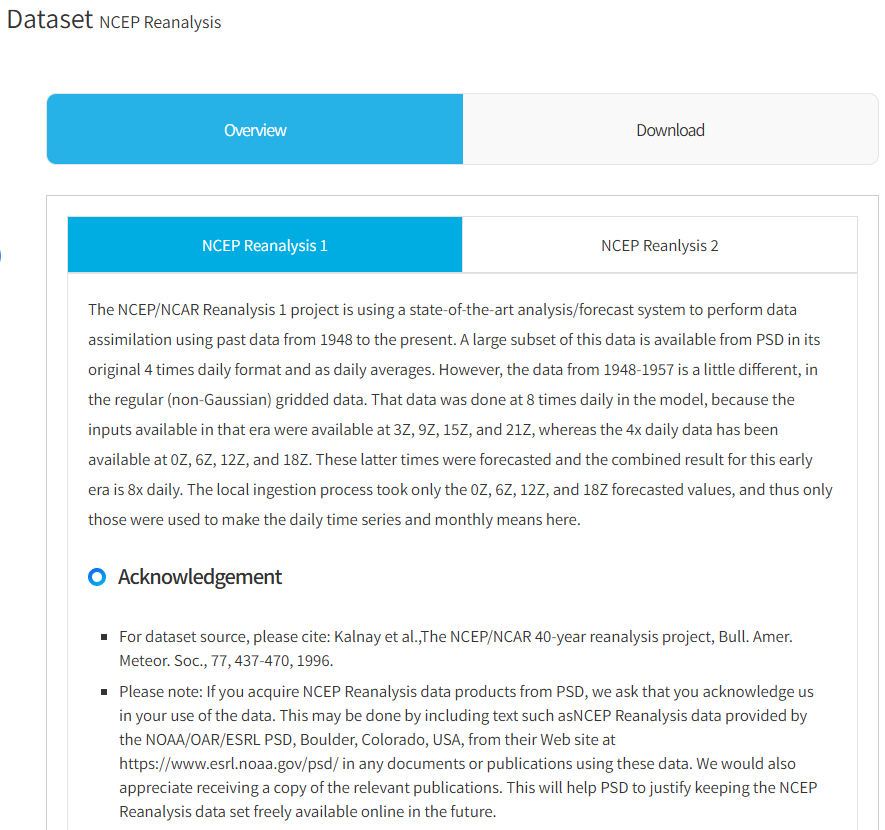
(Figure 3-2-35) NCEP Reanalysis Data - Overview
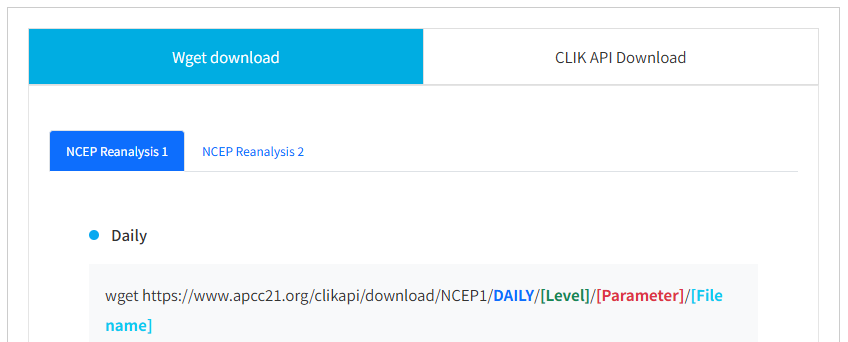
CLIK provides wget and CLIK API services for NCEP data download. Data download methods can be found in the Download tab.
(Figure 3-2-36) NCEP Reanalysis Data - Download
NCEP data can be downloaded by referring to the samples in the Wget download tab and CLIK API Download tab in the figure above. Users can write a wget or CLIK API script by selecting [Timestep], [Level], [Parameter], and [File name] of the data they want to download.
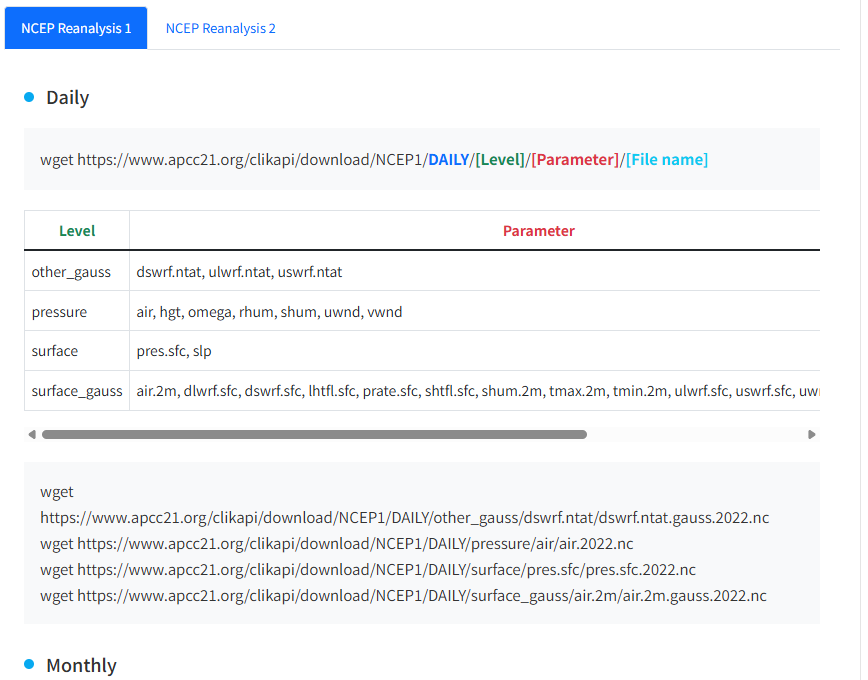
(Figure 3-2-37) NCEP Reanalysis Data - wget download
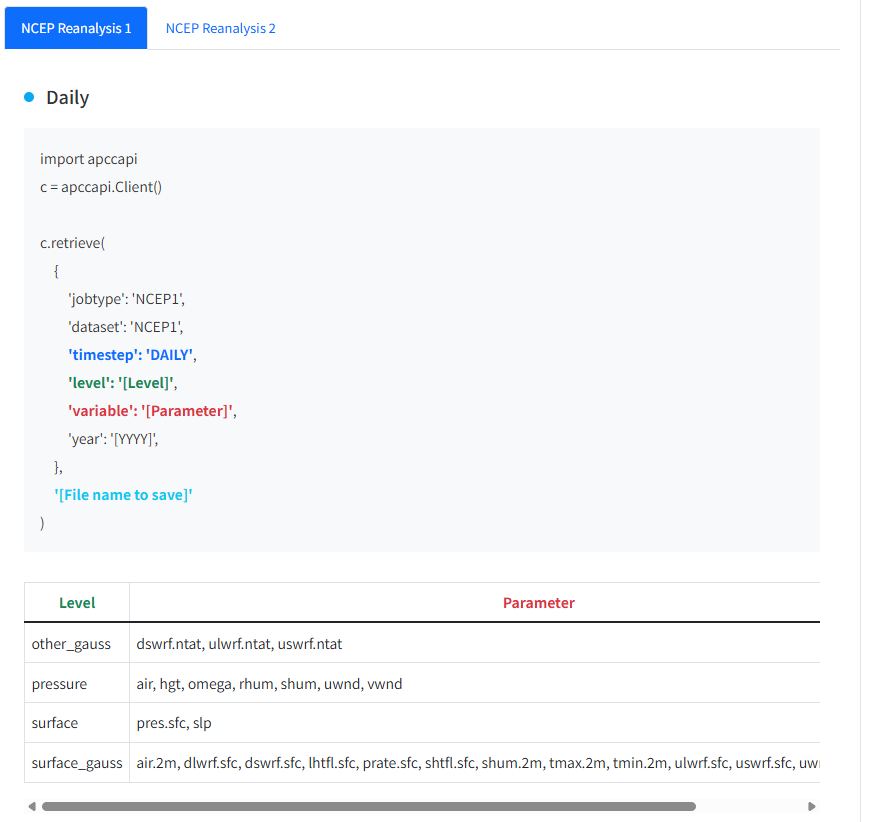
(Figure 3-2-38) NCEP Reanalysis Data - CLIK API download
III. Structure of CLIK Menu
2. Processing
A. Prediction Link
This is the Prediction menu of the CLIK developed based on the seasonal prediction system provided by APCC. Users can obtain desired seasonal prediction results by combining provided options.
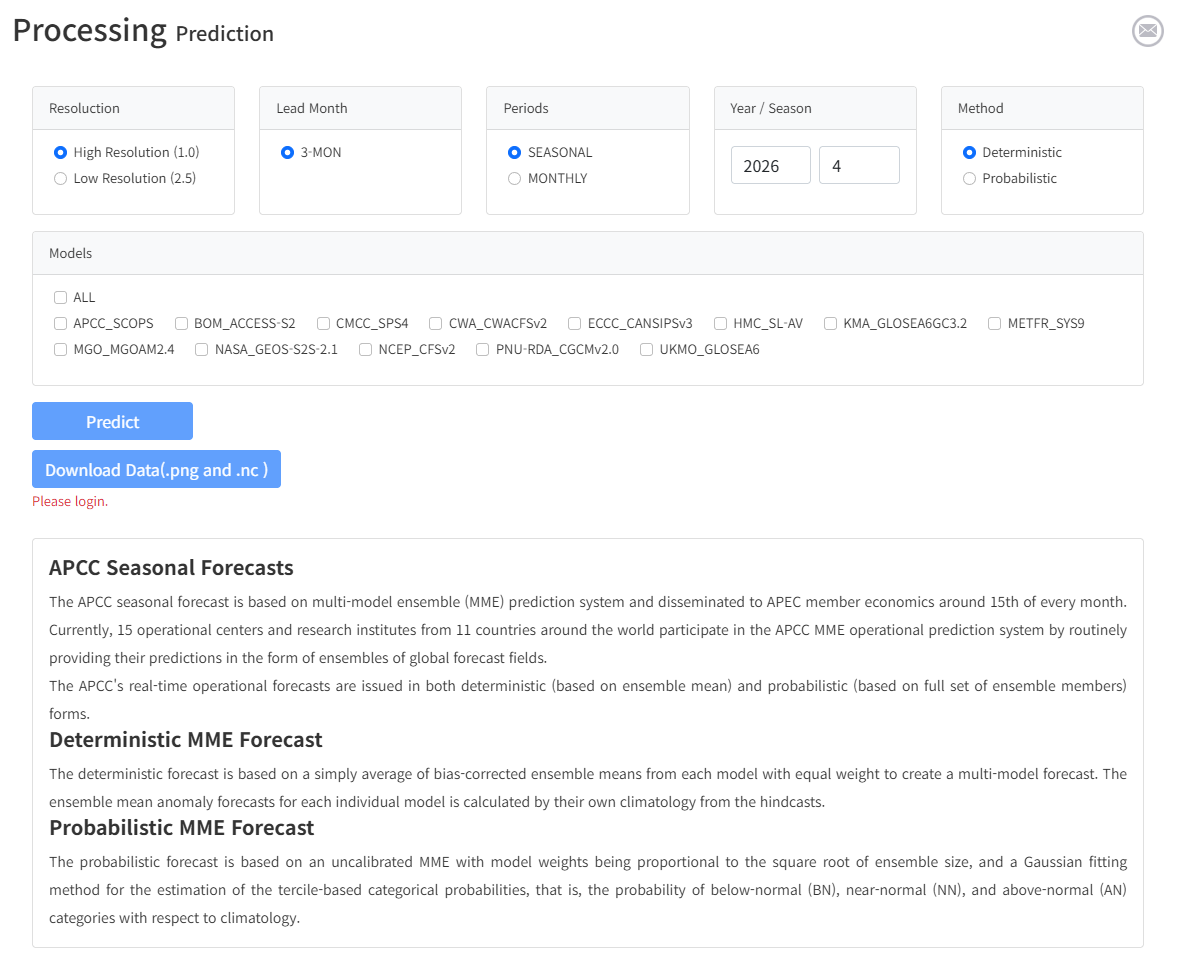
(Figure 3-3-1) Prediction Page
In the case of Prediction, users can use the service only after log in. If not logged in, the buttons are disabled as shown in the figure, and become enabled upon login.
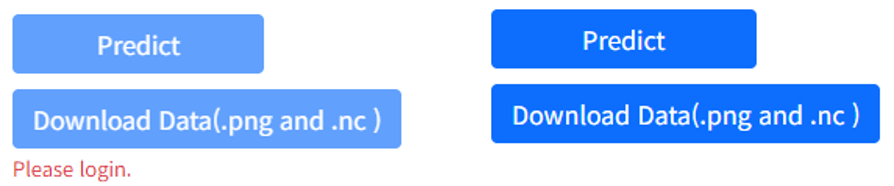
(Figure 3-3-2) Image Acriviation Before and After Login (Left: Before Login, Right: After Login)
Resolution: Select a resolution
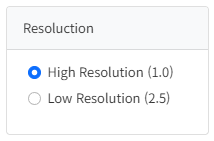
(Figure 3-3-3) Select Resolution
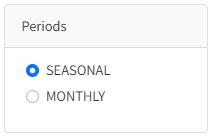
Periods : Select Period
Year / Season : Select the year and season for seasonal prediction.
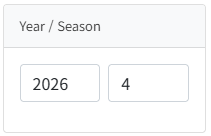
(Figure 3-3-5) Select Year and Season
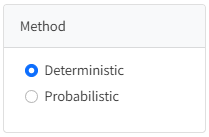
Methods : Select the desired method between Deterministic and Probabilistic prediction provided by the CLIK.
(Figure 3-3-6) Select Methods
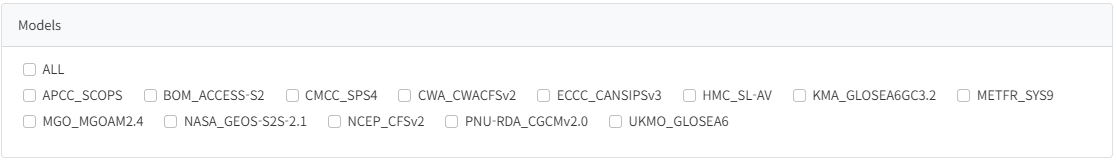
Models : Select the desired model. The list of models is updated for the year and month, and varies according to results updated monthly.
(Figure 3-3-7) Prediction Model List
Predict : Generate prediction results with conditions selected by the user. If results for the same conditions exist, they are displayed immediately. If not, results are generated with the selected conditions.
(Figure 3-3-8) Clicking Predict Button Generates Seasonal Prediction Results
If result image exists: Another user has already
generated it with the selected conditions. In this case, results are
displayed immediately without creating a separate job. Since the CLIK
platform shares combination results globally rather than managing them by
user, you can immediately check results if already generated by others.
Clicking the result image displays the original image
in a larger popup window.
(Figure 3-3-9) Predict Generation Result
If result image does not exist: If there are no results matching the selected conditions, a generation job is performed. Image generation is performed through a Queue, and progress can be checked on the My Jobs page. When the job is completed, a completion email is sent to the email address registered during sign-up.
(Figure 3-3-10) Generating Image When No Search Results
File Download : File download is provided in two formats: image format and nc file. Download files are provided only when results exist.
(Figure 3-3-11) Result Image and nc File Download Button
B. Verification Link
This is the Verification menu of the CLIK developed based on APCC's verification system. Users can obtain desired verification results by combining provided options.
(Figure 3-3-12) Verification Page
Like Prediction, Verification service requires login. If not logged in, buttons are disabled as shown in the figure, and become enabled upon login.
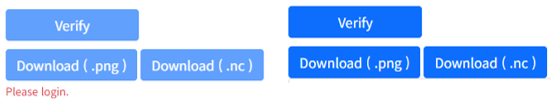
(Figure 3-3-13) Image Activation Before and After Login (Left: Before Login, Right: After Login)
Resoluction : Select Resoluction

(Figure 3-3-14) Select Resoluction
Year / Month : Select the desired year and month.

(Figure 3-3-15) Select Year and Month
Skills : Select one of the 4 verification methods provided by the CLIK.
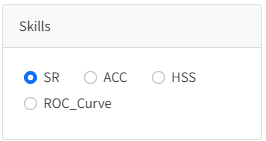
(Figure 3-3-16) Select Verification Method Provided by CLIK
Variable : In the Verification menu, you can obtain results by selecting one of the 6 variables provided by the CLIK.
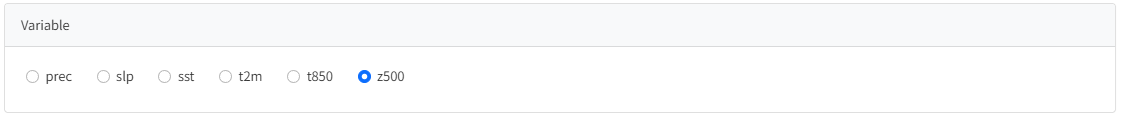
(Figure 3-3-17) Select Variable Provided by CLIK
Models : Select the desired model. The list of models is updated for the year and month, and varies according to results updated monthly.
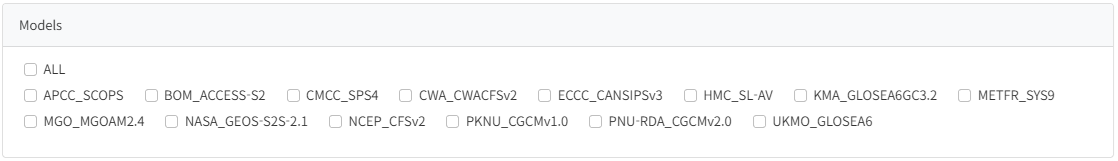
(Figure 3-3-18) Verification Model List
Verify : Generate results with conditions selected by the user. If results for the same conditions exist, they are displayed immediately. If not, results are generated with the selected conditions.
(Figure 3-3-19) Clicking Verify Button Generates Verification Results
If result image exists: Another user has already
generated it with the selected conditions. In this case, results are
displayed immediately without creating a separate job. Since the CLIK
shares combination results globally rather than managing them by
user, you can immediately check results if already generated by others.
Clicking the result image at the bottom of the screen
displays the original image in a larger popup window.
(Figure 3-3-20) Verification Generation Result
If result image does not exist: If there are no results matching the selected conditions, a generation job is performed. Image generation is performed through a Queue, and progress can be checked on the My Jobs page. When the job is completed, a completion email is sent to the email address registered during sign-up.

(Figure 3-3-21) Generating Image When No Search Results
File Download : File download is provided in two formats: image format and nc file. Download files are provided only when results exist.
(Figure 3-3-22) Result Image and nc File Download Button
C. Downscale Link
The Downscale menu provides a function to downscale prediction information using observation data and model data. The Downscale service also requires login.
(Figure 3-3-23) Downscale Menu Activation Before and After Login
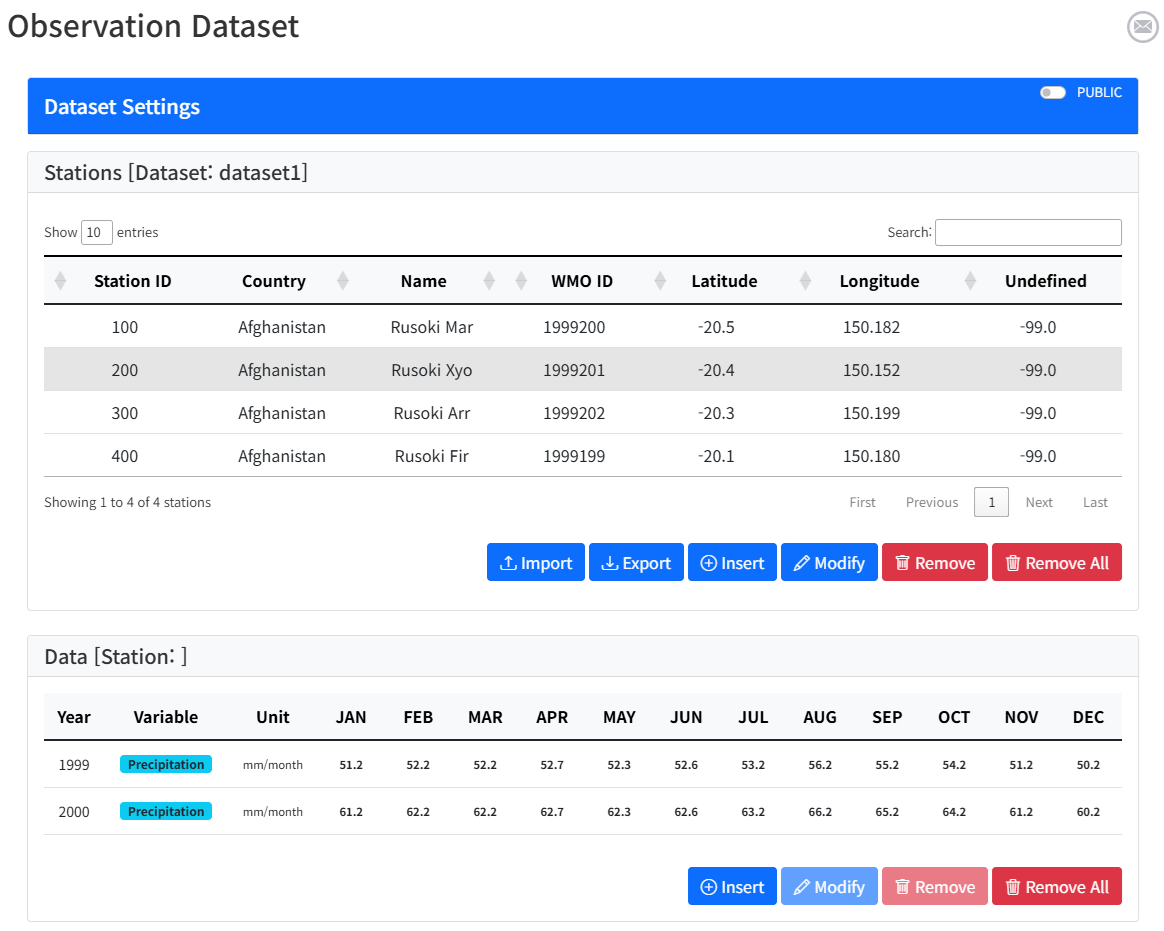
Observation values at observation points are required to execute prediction information downscaling. Therefore, a function is provided for users to input and edit observation data. Selecting the Downscale menu displays a table as shown below. Users must first add or select observation data from the table. Selecting observation data displays observation points on the map below. Users can select observation points on the map to request downscaling.
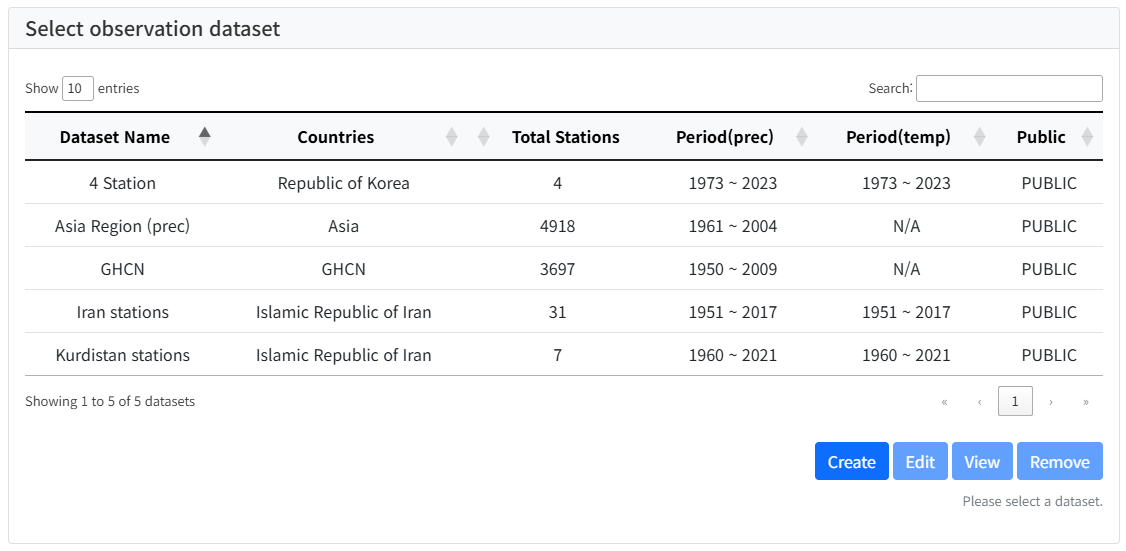
(Figure 3-3-24) Observation Data List
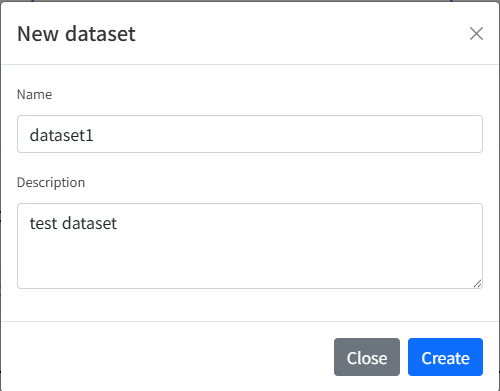
To add observation data, selecting the 'Create' button on the observation data list screen displays a screen where users can enter the name and description of the new observation data as shown below.
(Figure 3-3-25) Create New Dataset
Entering the name and description and selecting the 'Create' button adds the new observation data to the observation data table as shown below.
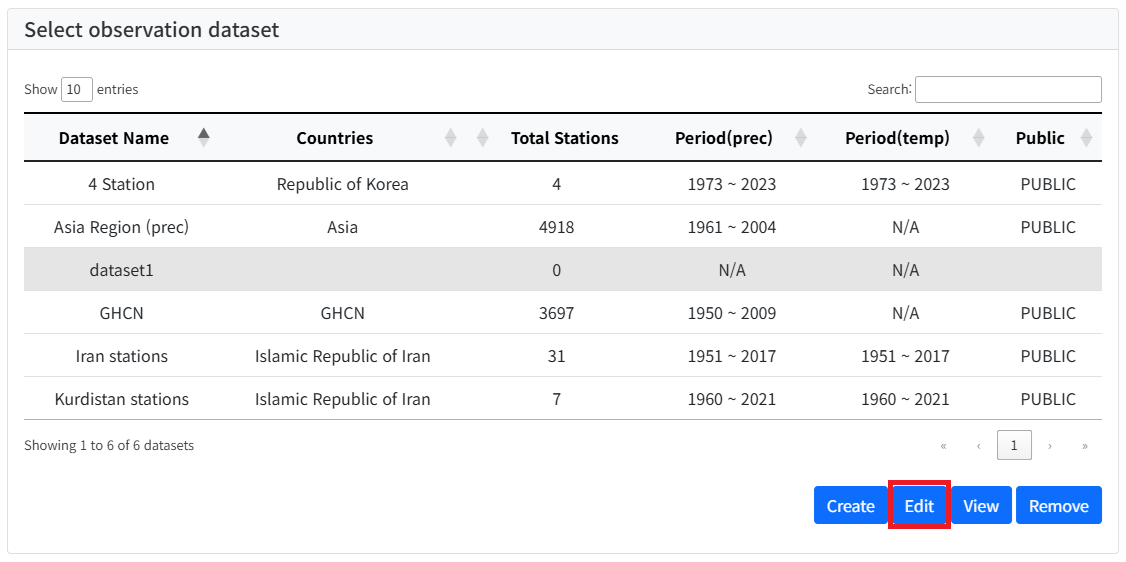
(Figure 3-3-26) Observation Data Table After Adding New Dataset
Users can create and manage their own observation data. To edit observation data, select the observation data to edit from the table as shown above and select the 'Edit' button. If observation points and values are added to the observation data dataset, the content is displayed as shown below.
(Figure 3-3-27) Observation Data Edit Screen
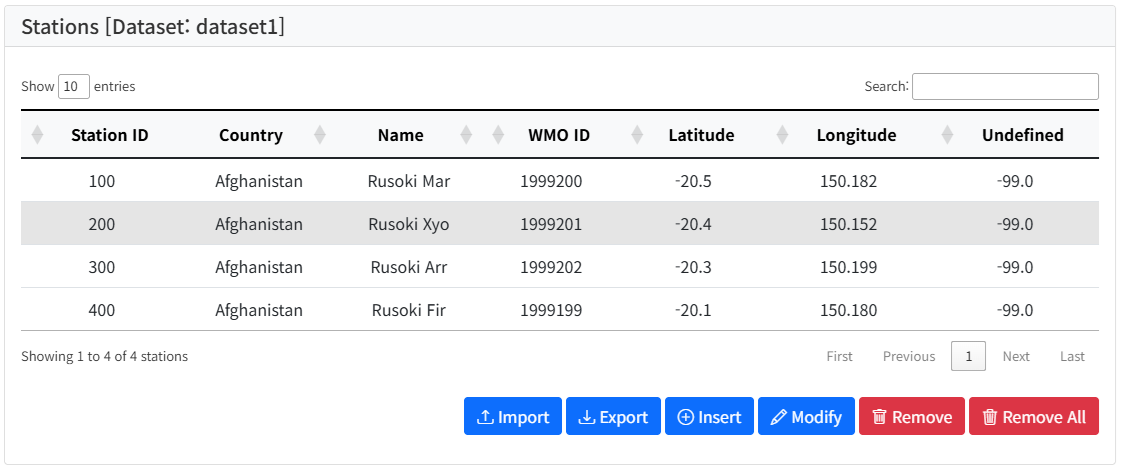
Users can register, modify, and delete observation points, and add, modify, and delete observation values for each observation point. The Import function allows consistent input of contents from a CSV file, and the Export function allows downloading currently entered data as a CSV file.
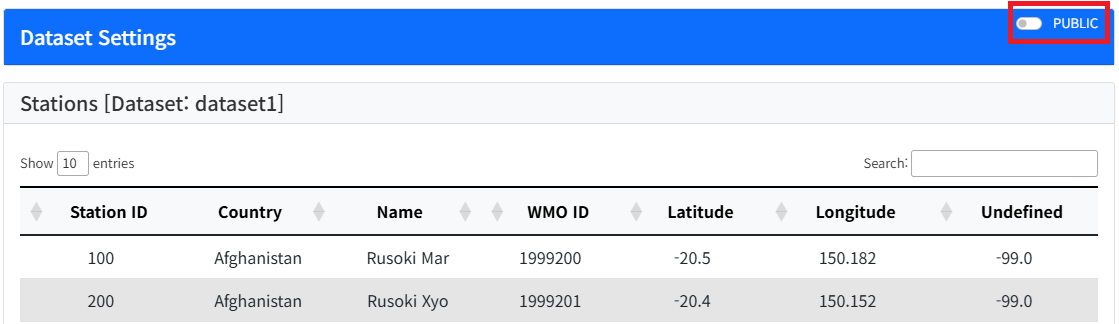
(Figure 3-3-28) Public Setting for Registered Observation Data
Checking 'PUBLIC' in the figure above makes the observation data registered by the user available to all users using the service.
In the observation data edit screen, users can manage observation points using buttons in the Stations area. Users can manually input observation points (Stations) by selecting the 'Insert' button as shown below.
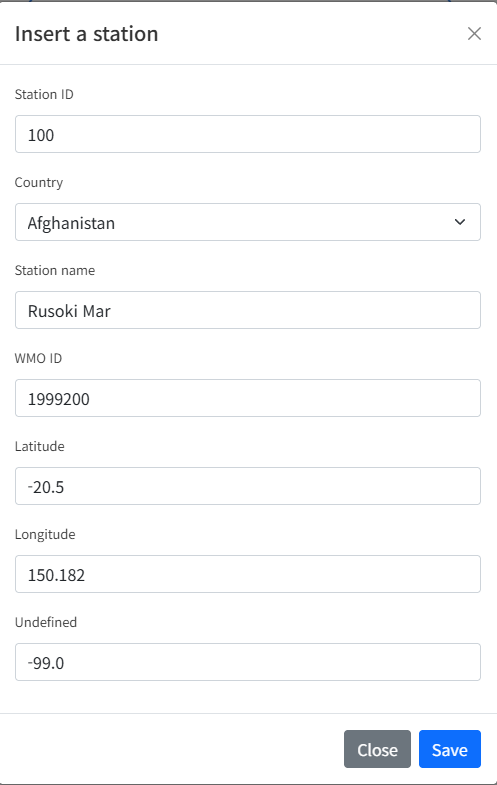
(Figure 3-3-29) Register Observation Point (Stations) Information
After entering observation point information, selecting the 'Save' button adds the observation point to the table. To input multiple observation points at once, select the 'Import' button.
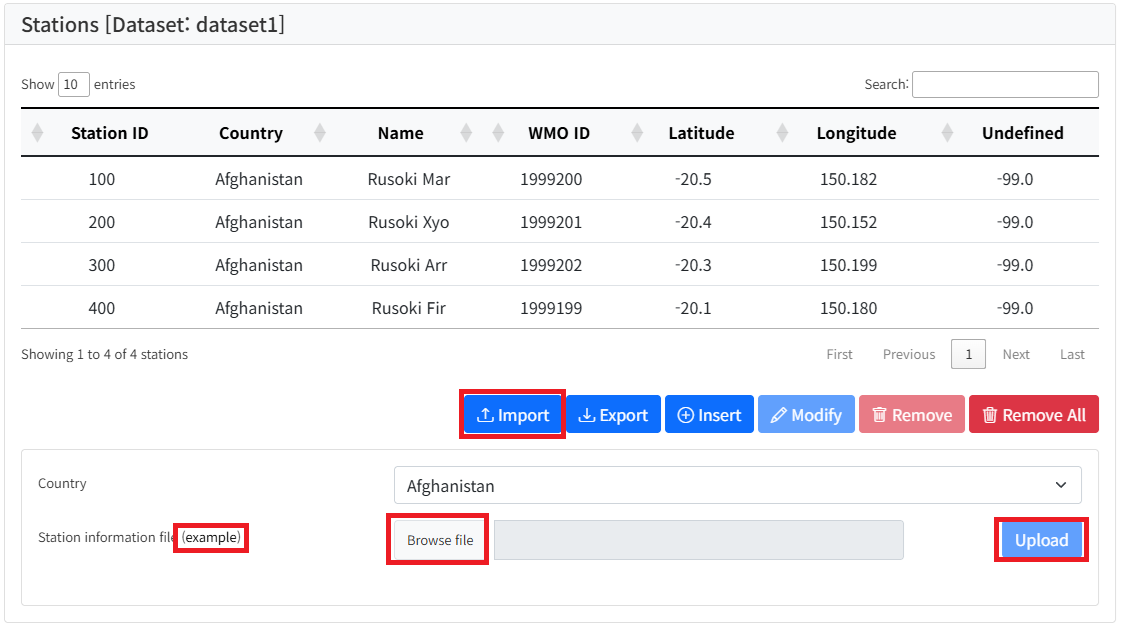
(Figure 3-3-30) Import Observation Points
Selecting the 'Import' button displays a file upload GUI as shown above. Select a country name, click 'Browse file', select a CSV file in the file selection window, and click 'Upload' to add observation point information stored in the CSV file.
(Figure 3-3-31) Observation Point Import Result
CSV formatting rules can be checked by selecting the 'example' button on the observation point Import screen.
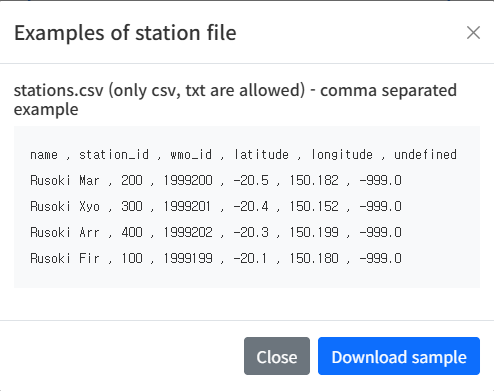
(Figure 3-3-32) Observation Point File Sample
Selecting the 'Download comma separated sample.' button allows downloading a sample CSV file.
Conversely to Import, selecting the 'Export' button allows downloading all currently entered observation points. Also, selecting an observation point and clicking 'Remove' deletes the selected observation point data. Deleting an observation point also deletes all observation values for that point. 'Remove All' deletes all currently entered observation point data.
Observation value management is the same as observation point management.
To request downscaling after adding observation data, users must first select observation points. Selecting observation data from the list displays observation point locations on the map as shown below. Dragging the map while holding the Shift key and left mouse button selects observation points within the area.

(Figure 3-3-33) Observation Data List
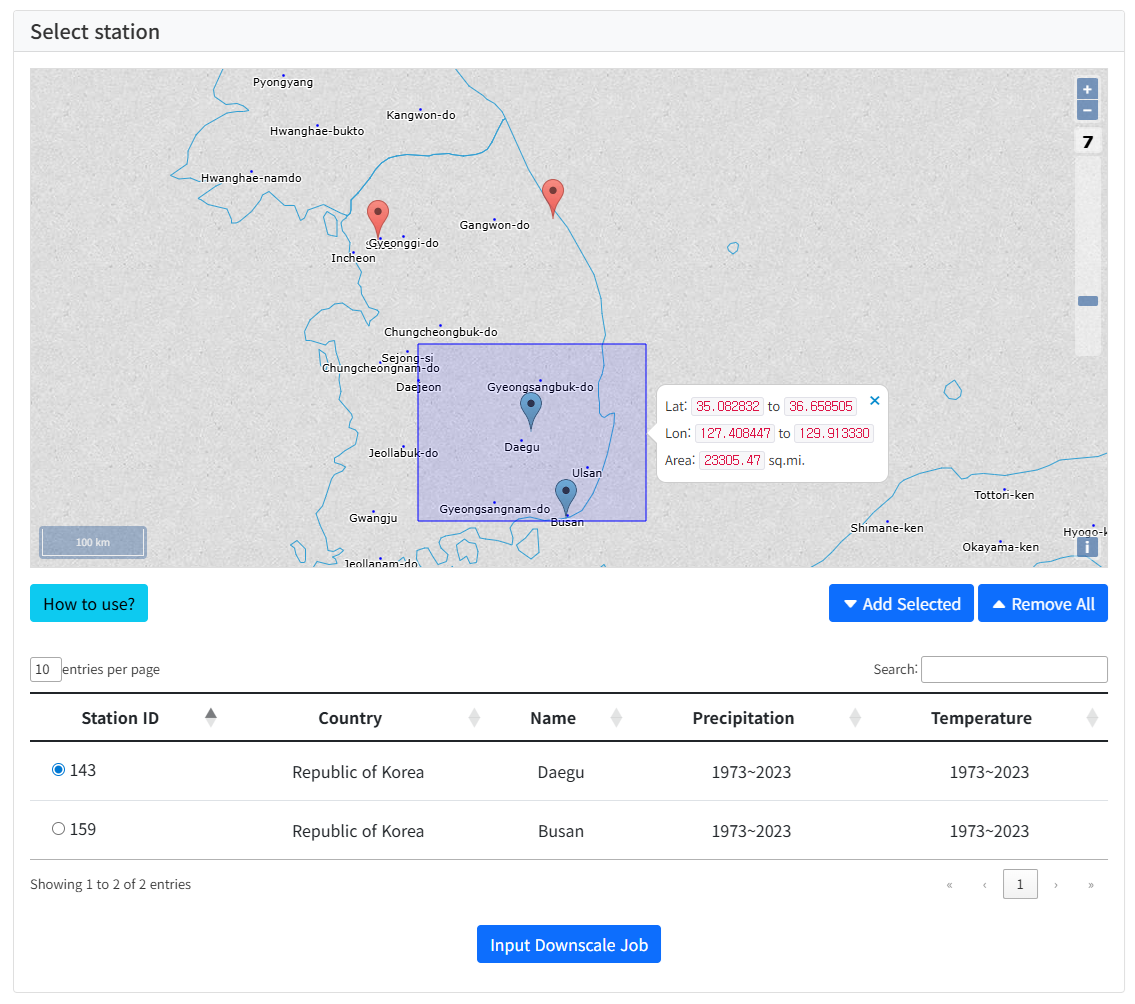
(Figure 3-3-34) Select Observation Point
After selecting observation points on the map, clicking 'Add Selected' adds them to the bottom table as shown above. 'How to use?' provides more details on selecting observation points on the map. Selecting one desired observation point from the table and clicking 'Input Downscale Job' allows inputting a downscaling job.
Requesting downscale job input after selecting an observation point displays a GUI for entering execution conditions as shown below.

(Figure 3-3-35) Downscale Job Input Screen
The GUI is divided into 4 parts. The Station information part displays information on the selected observation point. In the Predictand part, users can select the downscale season (year, month) and observation value variable.
In the Predictor part, select prediction information. Selecting a Variable displays prediction models containing that variable. Select a model from the list and then the Training period. Advanced Options are selected by default and can be changed if desired.
In the Domain part, select the predictor domain. Select an area by dragging the map while holding Shift and left mouse button, or input directly in the GUI. A correlation map is provided to help with area selection. Selecting 'Check pattern' displays the correlation map as shown below.
Finally, selecting the 'Downscale' button on the job input screen submits the downscale job.
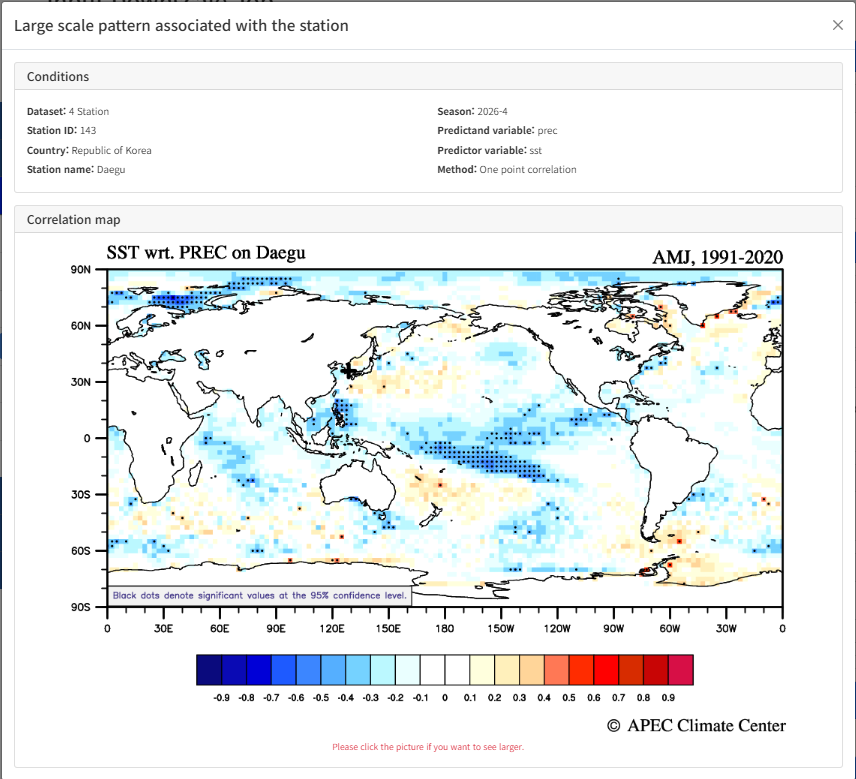
(Figure 3-3-36) Correlation map
After the downscale job is submitted, progress can be checked in the My Jobs menu. Downscaling results vary depending on selected observation info, model, and predictor domain, and failure probability is high if suitable results are not derived. If successful, 'Download', 'Edit', and 'Result' buttons are displayed as shown below.

(Figure 3-3-37) Downscale Result Screen
Selecting 'Download' downloads the result file. Selecting 'Edit' displays the execution conditions entered by the user. Conditions can be adjusted to request the job again.
Selecting 'Result' displays the downscale execution result. The execution conditions entered by the user are valid at the top as shown below.

(Figure 3-3-38) Downscale Execution Result - User Input Execution Conditions
Selecting a desired list from the model list displays the result as shown below.

(Figure 3-3-39) Downscale Execution Result
D. Clipping Link
The Clipping service function can be found in the Clipping menu under Processing. (Note: The clipping service is only enabled when logged in.) The clipping service's initial screen and configuration vary depending on the data (APCC-MME, Individual Model) the user intends to use for extraction.
You can process individual data by selecting MME from the top tab to select APCC Multi-Model Ensemble or selecting Individual to select individual models produced by each institution.
The figure below shows the screen when the APCC-MME data extraction service is selected.
(Figure 3-3-40) APCC-MME Selection Screen and Initial Screen
- Leadtime : MME models provide 3 months and 6 months. You can select the desired period.
- Year/Month : You can select the year/month of the MME model to extract. MME model data is updated to the latest around the 15th of every month.
- Method : Deterministic (Deterministic MME) and Probabilistic (Probabilistic MME) methods are provided.
- Period : You can select seasonal mean and monthly mean.
- Variable : You can select each variable included in each model.
- Coordinate : Users can set the desired area by inputting the latitude/longitude coordinates they wish to extract.
- Region : Commonly used regions are defined in advance, so you can select Global, Australia, Australia_S.Pacific, East Asia, Middle East, North America, Russia, South America, South Asia, etc.
- Country : Extracts data based on the maximum boundary value of the selected country.
The menu configuration for data extraction service when APCC Individual Model is selected is as follows.
(Figure 3-3-41) Individual Model Selection Screen and Initial Screen
- Year/Month : You can select the year/month of the MME model to extract.
- Institute : You can select the name of the institution providing the model. When an institution name is selected, the Model name changes automatically. You can select the desired period.
- Variable : You can select each variable included in each model.
Clipping Area (Coordinates, Region, Country) is configured in the same way as MME. You can select seasonal mean and monthly mean.
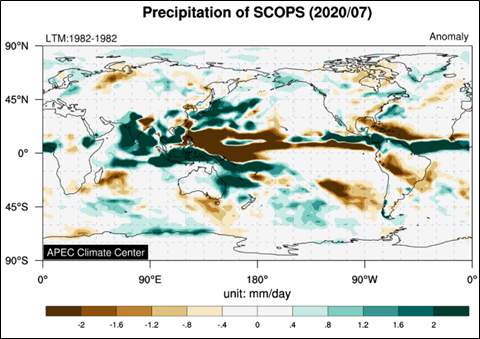
After setting the values as desired and clicking the Data Plot button in the center of the screen, the following result screen appears.

(Figure 3-3-42) Anomaly 6-month Data Result for Precipitation of SCOPS Model
If users want to see the result screen in detail, clicking the screen brings up a larger screen as shown below for detailed verification.
(Figure 3-3-43) Large Screen Appearing by Clicking Result Image
Also, you can download data in the desired file format (NetCDF, Excel) via the Download Result button at the bottom of the screen.
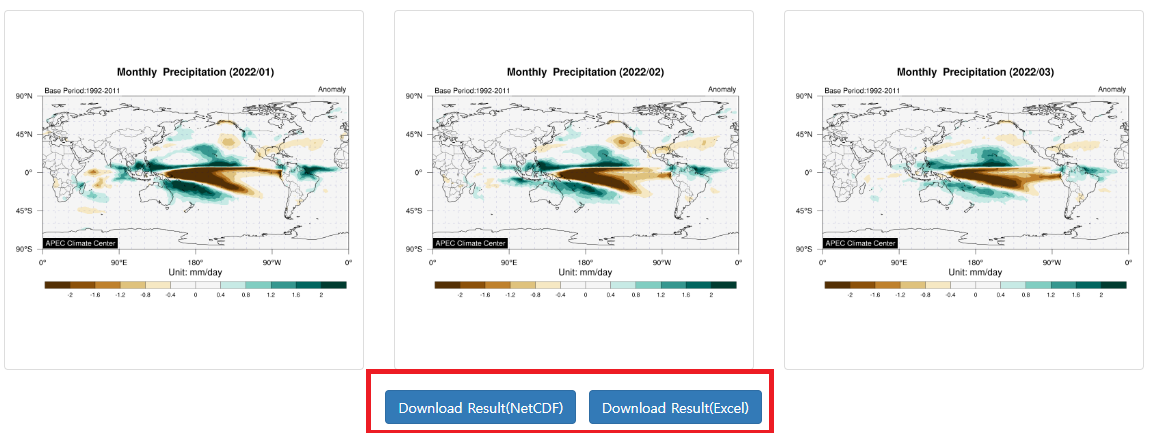
(Figure 3-3-44) Result File (NetCDF, Excel) Download Button Screen
E. Composite Link
The Processing ??Composite menu provides functions to composite prediction/observation data by year, month, etc. Users can select desired years and months and input conditions for the desired composite result to derive results.
Entering the Composite menu allows users to see the condition setting screen at the bottom. The menu configuration of the condition check screen is as follows.
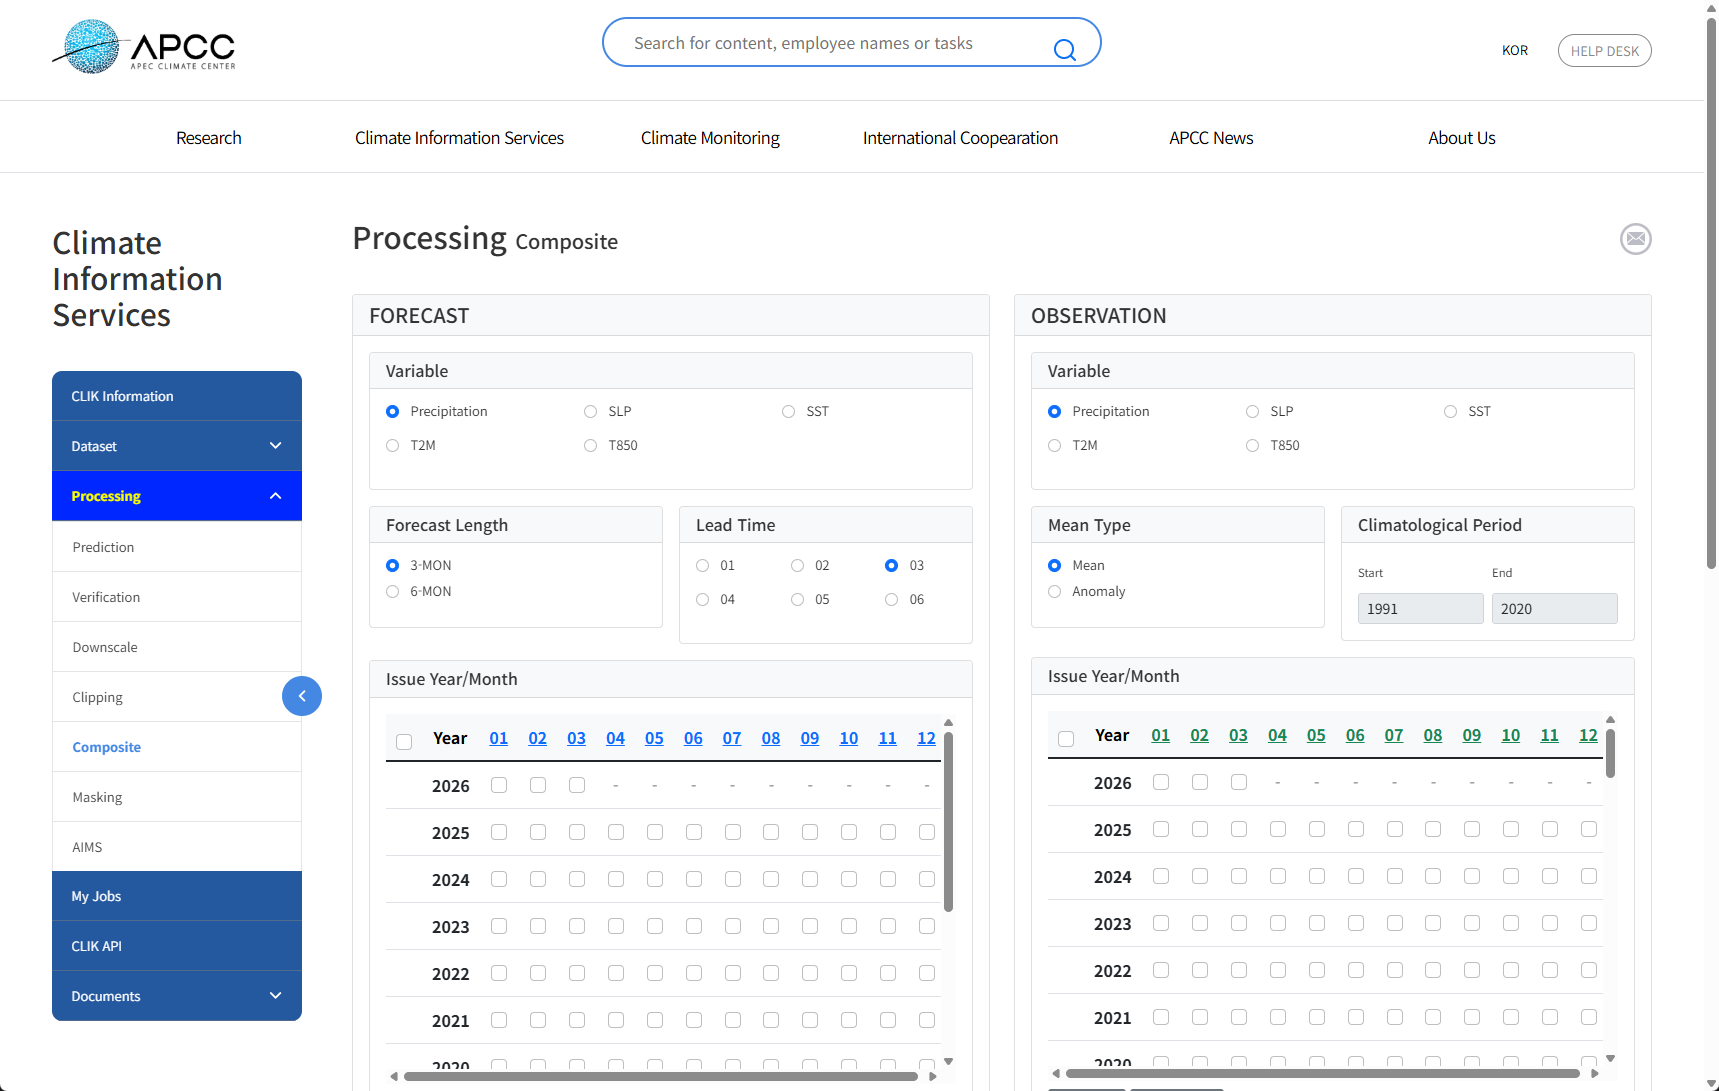
(Figure 3-3-45) Screen for Inputting Conditions for Composition of Prediction and Observation Data
- Variable : You can select the variable of the prediction data.
- Forecast Length : Select 3 months or 6 months for MME data.
- LeadTime : Select the Lead Time to composite.
- Date : Select the year/month to composite. Selecting a number representing a year or month selects all corresponding years/months collectively.
The data composition service allows analyzing data under various conditions using seasonal prediction data and observation data.
After entering the desired comparison values and clicking the Plot button at the bottom, the Composite Map result appears as below.
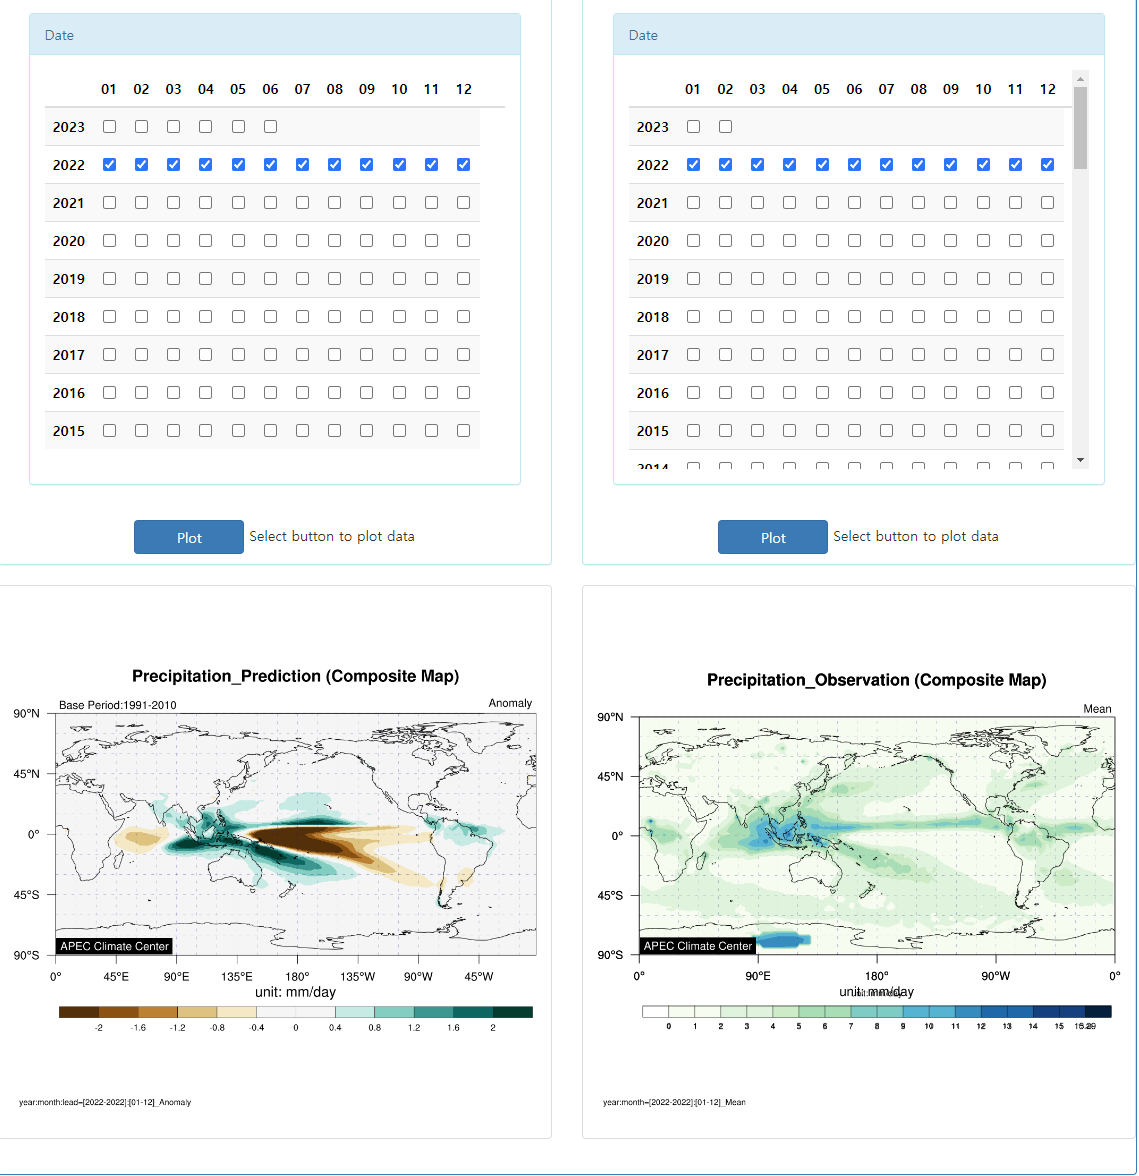
(Figure 3-3-46) Composite Map Result Screen
F. Masking Link
The Processing ??Masking menu provides a geographical information-based masking function that supports data extraction for precise areas. Users can select the desired year, month, and region to derive desired results.
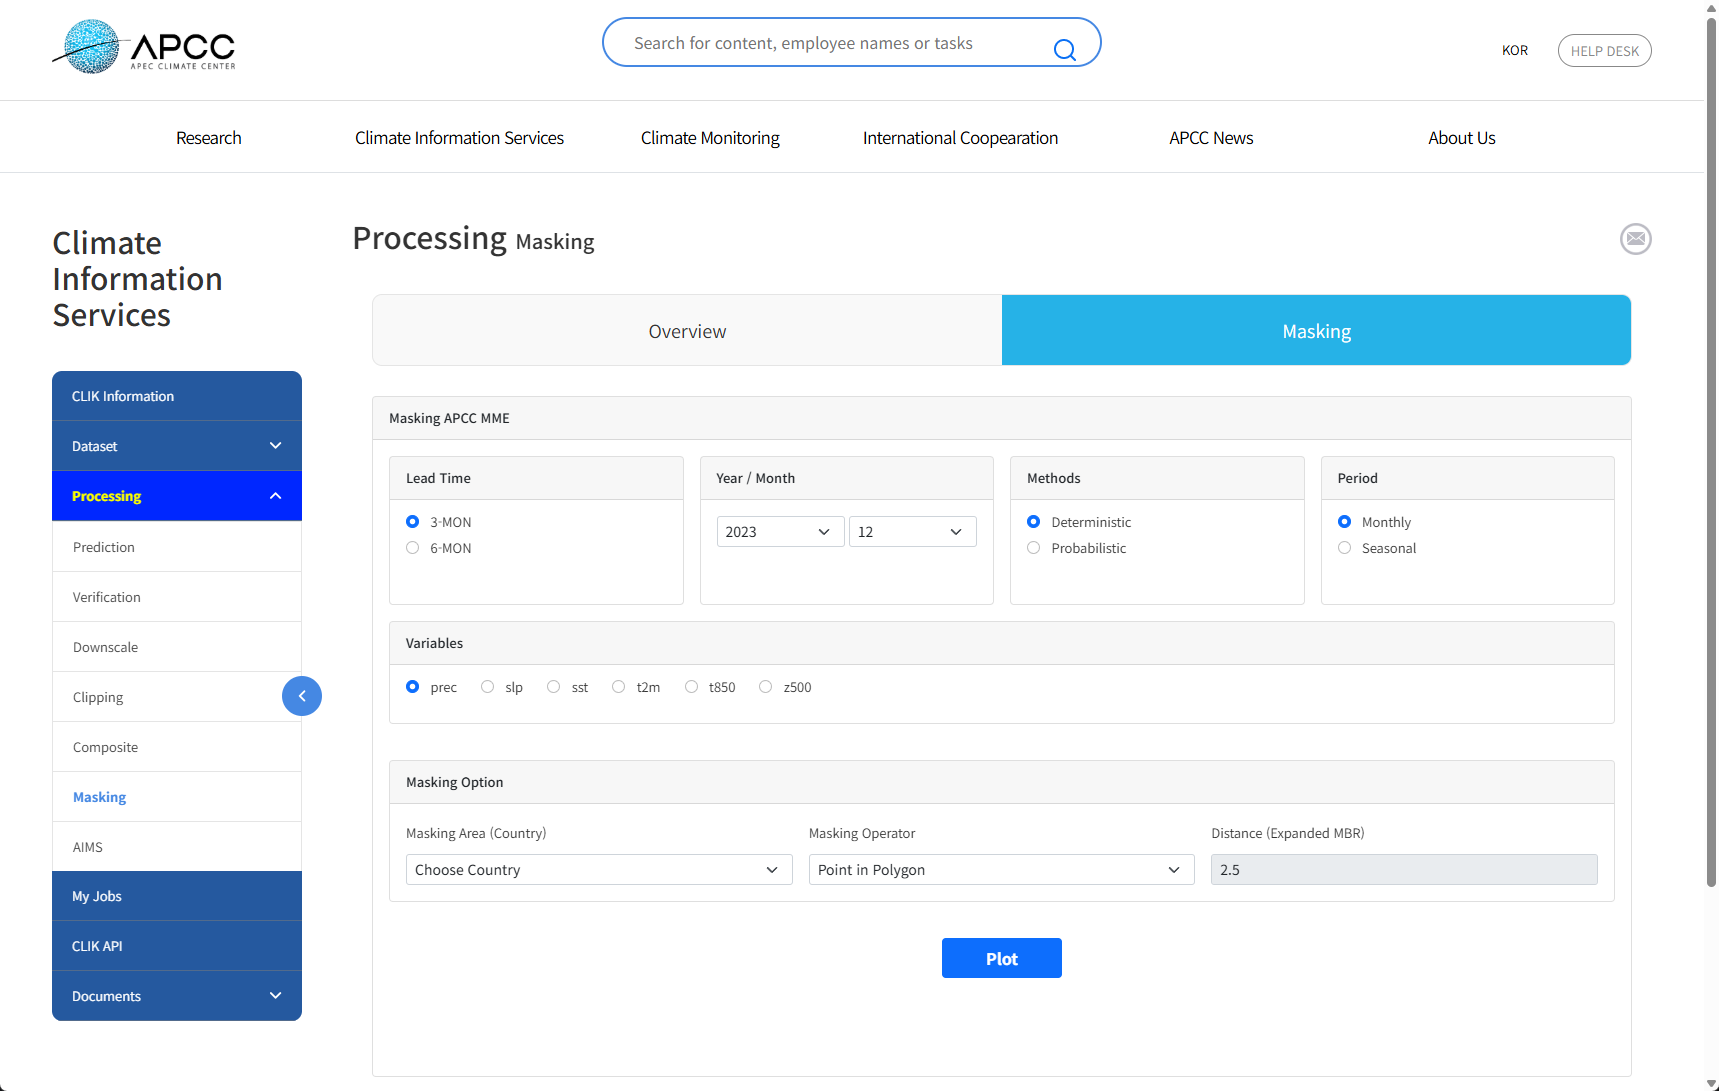
(Figure 3-3-47) Masking Initial Screen
- Leadtime : MME models provide 3 months and 6 months. You can select the desired period.
- Year/Month : You can select the year/month of the MME model to extract. MME model data is updated to the latest around the 15th of every month.
- Method : Deterministic (Deterministic MME) and Probabilistic (Probabilistic MME) methods are provided.
- Period : You can select seasonal mean and monthly mean.
- Variable : You can select the variable of the prediction data.
- Masking
Operator : The Masking function provides a total of 4 types of
Masking Operators.
> Point in Polygon : An algorithm that
determines whether a point is inside a given polygon. It distinguishes
between the boundary and interior of the polygon, checks if the point
belongs to the interior, and marks the area if it does.
> Point in MBR(Minimum Bounding Rectangle) :
An algorithm that determines whether a point belongs to a given MBR. MBR is
the smallest rectangle enclosing the national boundary.
> Point in Expanded MBR(Minimum Bounding
Rectangle) : An algorithm that determines whether a point belongs to an area
where the MBR is expanded (refer to Distance value). It uses a rectangular
area created by expanding the national boundary's MBR.
> Rectangle(Cell Boundary) Intersects Polygon
: This algorithm determines whether a rectangle (cell boundary) and a
polygon intersect. It checks if the cell boundary and polygon overlap or
intersect to determine intersection.
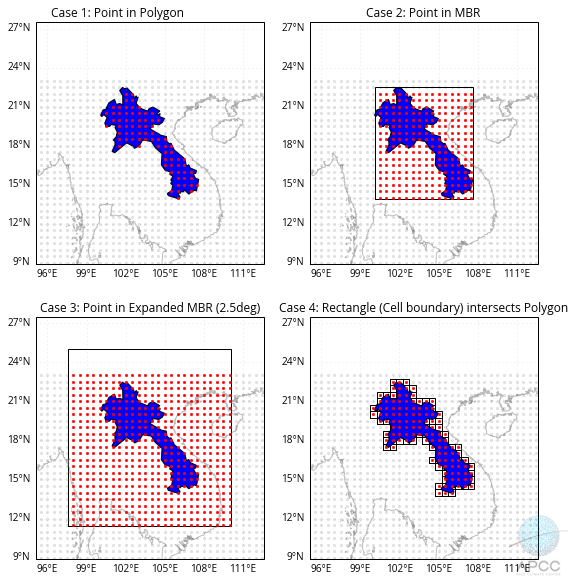
(Figure 3-3-48) Comparison of Masking Operators
After selecting the desired values to extract, clicking the Plot button at the bottom displays the Masking result values as below.
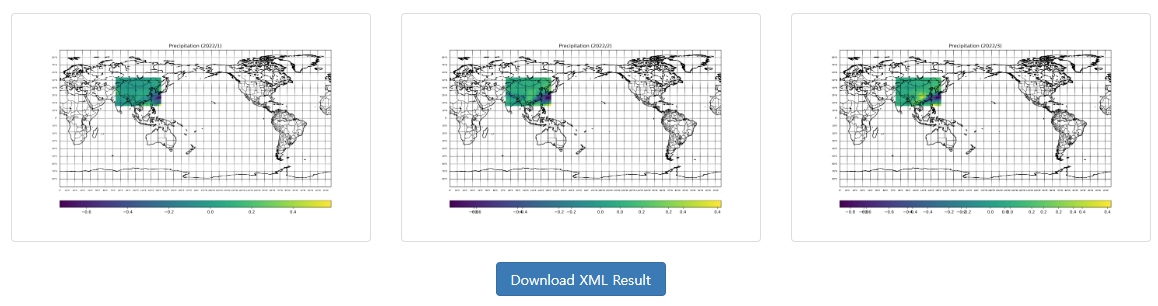
(Figure 3-3-49) Masking Result Window
Selecting the Download XML Result button on the result screen allows downloading the masking result values in XML format.
G. AIMS(APCC Integrated Modeling Solution) Link
AIMS is a tool for producing statistical downscaling/evaluation information for climate change scenarios and seasonal prediction. The purpose of this project is to provide a user-friendly climate change scenario downscaling tool by including many functions in one program.
(Figure 3-3-50) AIMS Menu Screen
AIMS is not a web program running in a web browser, but can be used after installing a stand-alone program on a user PC with Microsoft Windows operating system. The Processing ??AIMS menu on the climate service platform provides an introduction to AIMS and links to download the AIMS client program/manual/example data.
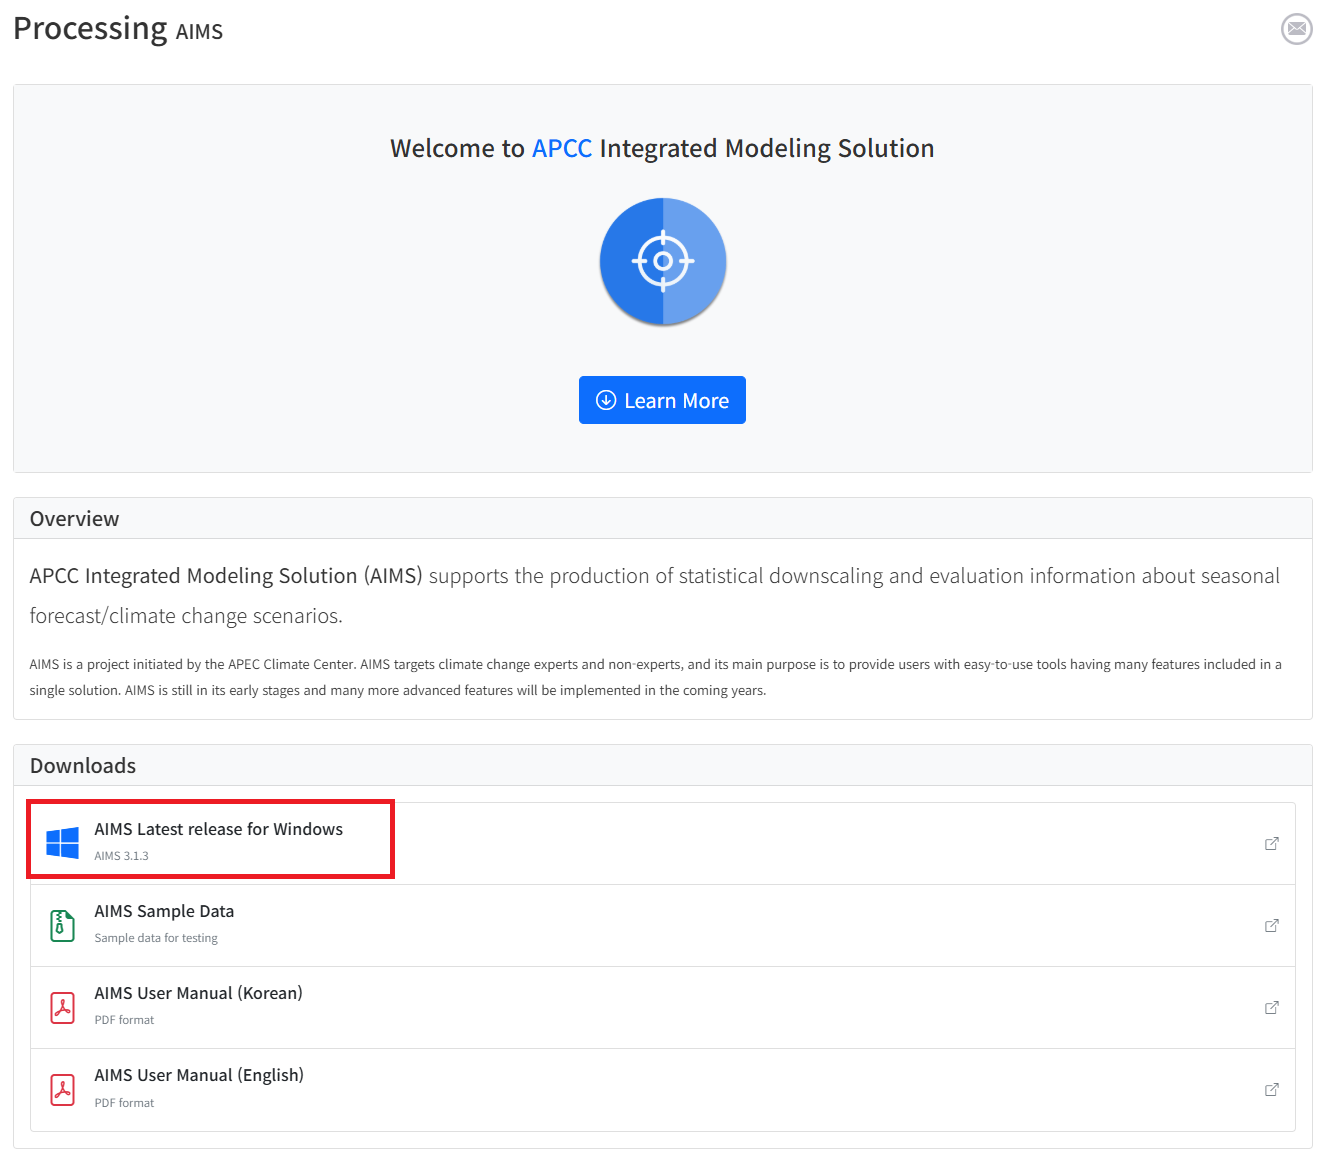
(Figure 3-3-51) AIMS Page Initial Screen
AIMS runs on 64-bit Microsoft Windows systems (Windows 7 or higher), and requires at least 8GB of memory and 100GB of storage. Detailed information and descriptions of functions are provided in the manual available on the AIMS page.
III. Structure of CLIK Menu
3. My Jobs
A. Message Queue
When data is requested from the Dataset Download tab or Processing menu, the Job ID can be checked at the top right of the screen as shown in the following figure. The Job ID notification message disappears shortly after being displayed. Most user requests on the 1 are managed as Jobs, and all users' Jobs are processed sequentially. The number of Jobs a user can request simultaneously is limited.

(Figure 3-4-1) Job ID Notification Message
Users can check the list of requested Jobs and their progress in the My Jobs menu.
- Selecting 'Auto Refresh' at the top automatically updates the Job list every 30 seconds.
- The Job list shows the Job type, input time, end time, and progress status.
- Jobs are classified into 4 states: Queued, Running, Failed, and Completed.
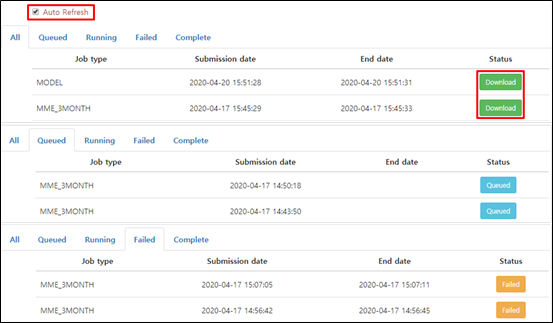
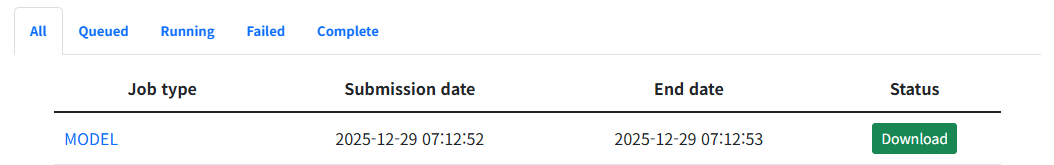
(Figure 3-4-2) Job List
- When a Job is successfully completed, the Job status changes to Download, and selecting the 'Download' button downloads the result data.
- If 'Auto Refresh' is not selected, selecting the Job Type (MME_3MONTH, MODEL, Prediction, Verification, etc.) in the list allows checking the detailed contents of the Job.
In the case of a failed Job, as shown in the figure below, the cause of the error can be seen.
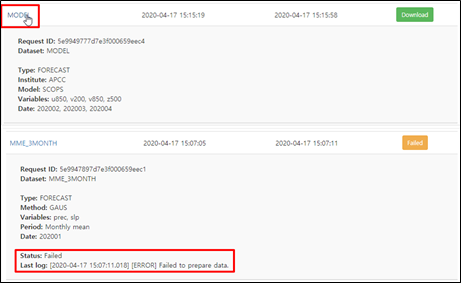
(Figure 3-4-3) Detailed Job Information
4. CLIK API
The CLIK Open Application Program Interface (API) is a service that allows users to use data through programming. Users can add code to download data within their own code using the API. The CLIK currently provides API Clients in Python and Java. This tutorial introduces how to use the Python language.
A. Setting API Key
An API Key is essential when using the API. The User Key can be set as follows.
- If you do not have a user account, sign up in the 'Registration' menu.
- After login, select the 'Get key' button in the 'Member Info' menu to issue a Key.
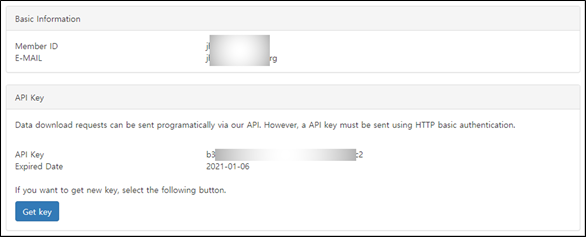
(Figure 3-5-1) User Key Issuance
- Record the following content in the $HOME/apccapi.properties file (refer to the Appendix for $HOME settings).
                                                key=810050f2-727e-5ed3-a871-b7a881a04d34

                                                request_url=https://www.apcc21.org/clik/clikapi/request/apccdata

                                                status_url=https://www.apcc21.org/clik/clikapi/request/status
[Code 1] apccapi.properties
B. Installing API Client
CLIK provides an API Client written in Python. You can install the API Client in the following way.
- Download the API client from the CLIK API page or download it directly using wget.
- Install the API Client in the working folder as follows.
                                                $ wget https://www.apcc21.org/clikapi/download/pythonapi -O apccapi.tar.gz

                                                $ tar xvf apccapi.tar.gz
[Code 2] API Client Download and Installation
C. Using API Client
After installing the API Client, users can call the API to request data within the program.
Users can download 3-month and 6-month MME data using Python as follows. Options such as type, method, variable, etc. in the example can be checked on the Dataset Download page.
                                                #!/usr/bin/env python

                                                import apccapi

                                                c = apccapi.Client()

                                                c.retrieve(

                                                {


                                                       'jobtype': 'MME',

                                                       'dataset': 'MME_3MONTH',


                                               'type': 'FORECAST',

                                               'method': 'SCM',

                                               'variable': ['prec', 't2m'],

                                               'period': ['Monthly mean'],

                                               'yearmonth': ['201909', '201910']

                                            },


                                                       'mme3.zip'


                                            )
[Code 3] Python Example: MME (3-Month)
                                                #!/usr/bin/env python

                                                import apccapi

                                                c = apccapi.Client()

                                                c.retrieve(

                                                {


                                                       'jobtype': 'MME',

                                                       'dataset': 'MME_6MONTH',


                                               'type': 'HINDCAST',

                                               'method': 'GAUS',

                                               'variable': ['prec', 't2m'],

                                               'period': ['Monthly mean', 'Seasonal mean'],

                                               'yearmonth': ['201909']

                                            },


                                                       'mme6.zip'


                                            )
[Code 4] Python Example: MME (6-Month)
Users can download MME model data using Python as follows. Options such as type, institute, model, variable, etc. in the example can be checked on the Dataset Download page.
                                                #!/usr/bin/env python

                                                import apccapi

                                                c = apccapi.Client()

                                                c.retrieve(

                                                {


                                                       'jobtype': 'MODEL',

                                                       'dataset': 'MODEL',


                                               'type': 'FORECAST',

                                               'institute': 'APCC',

                                               'model': 'SCOPS',

                                               'variable': ['prec', 't2m'],

                                               'yearmonth': ['201909']

                                            },


                                                       'model.zip'


                                            )
[Code 5] Python Example: Model
Users can download CMIP5 data using Python as follows. The code value in the example can be checked on the Dataset Download page.
                                                #!/usr/bin/env python

                                                import apccapi

                                                c = apccapi.Client()

                                                c.retrieve(

                                                {


                                                       'jobtype': 'CMIP5',

                                                       'dataset': 'CMIP5',


                                               'code': 'AD'

                                            },


                                                       'cmip5.zip'


                                            )
[Code 6] Python Example: CMIP5
IV. Appendix
Application Installation and Configuration for CLIK Usage
Python
To use the CLIK API, installation of the Python language is required. To use Python in a Windows PC environment, applications such as Python or Anaconda, which provides Python as a virtual environment, are required.
Python execution is possible if just one of the two programs, Python or Anaconda, is installed, so proceed with the installation by referring to the installation process below. (If you are a user skilled in using the Python language, installation of Anaconda, which makes virtual environment configuration easy, is recommended.)
(1) Python
A. Python Download
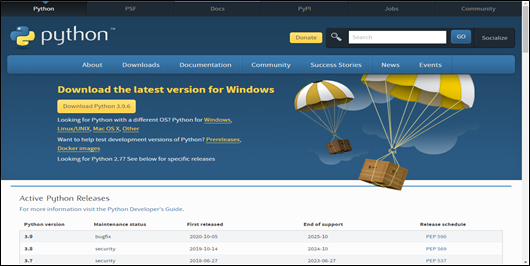
(Figure 4-1-1) Python Official Download Homepage
Download the Python suitable for your operating system from the download page of the Python official homepage (http://www.python.org/downloads). When you go to the site, you can check the latest released Python. Download using the Download Python 3.9.6 (currently the latest version) button in the center of the screen above or the download link for the desired version at the bottom of the page. (Currently the latest version is 3.9.6)
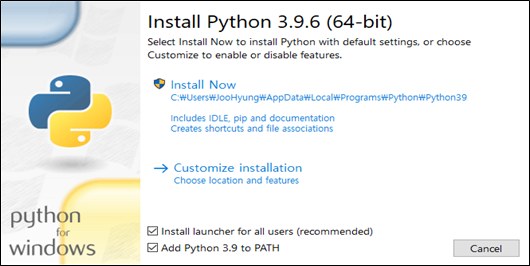
B. Python Installation
After running the installer, select "Install Now" to proceed with the installation immediately. You must select the "Add Python 3.9 to PATH" option so that Python can be executed from anywhere.
(Figure 4-1-2) Python Installation Screen
If Python is installed correctly, you can check it in the program menu as shown in the following figure. [Start ??All Programs ??Python 3.9]
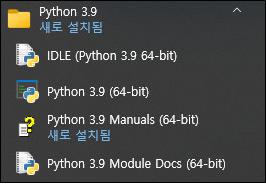
(Figure 4-1-3) Python Installation Check
IV. Appendix
Anaconda
A. Anaconda Download
To install Anaconda, go to the Conda download homepage. The download homepage address is as follows. https://www.anaconda.com/products/individual
Currently, Anaconda provides 4 Editions: Individual, Commercial, Team, and Enterprise. This tutorial uses the Individual Edition. When you go to the download page, there is a Download button in the middle right of the screen. Executing the download button downloads Anaconda for the corresponding operating system.
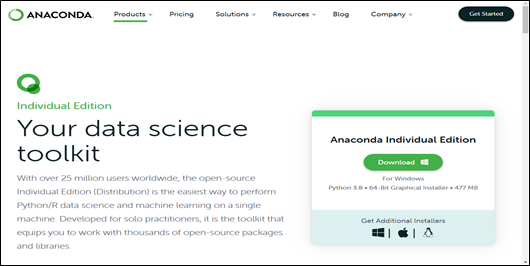
(Figure 4-2-1) Anaconda Download Page
B. Python Installation
Execute the Anaconda installation file downloaded from the download page and proceed with the installation process as shown in the figure below.
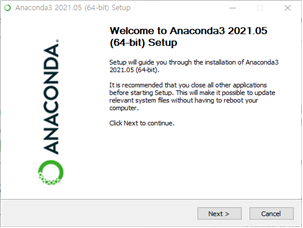
(Figure 4-2-2) Anaconda Installation Process -1-
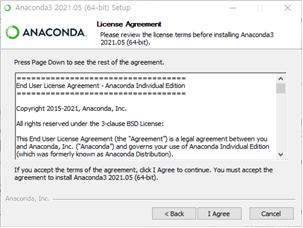
(Figure 4-2-3) Anaconda Installation Process -2-
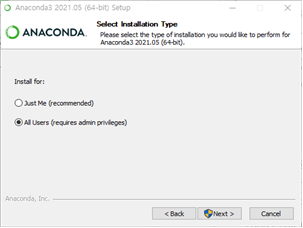
(Figure 4-2-4) Anaconda Installation Process -3-
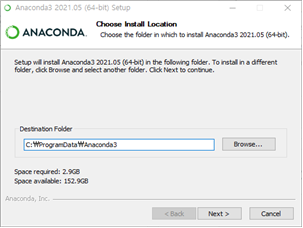
(Figure 4-2-5) Anaconda Installation Process -4-
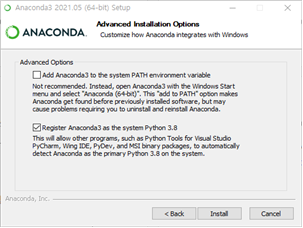
(Figure 4-2-6) Anaconda Installation Process -5-
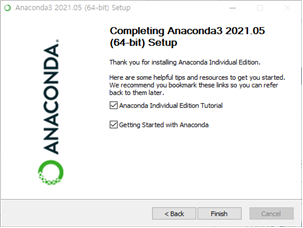
(Figure 4-2-7) Anaconda Installation Process -6-
When the Anaconda installation is complete, run Anaconda Prompt from Start - All Programs - Anaconda3 (64-bit) as shown in the figure below.
(Figure 4-2-8) Running Anaconda Command Window
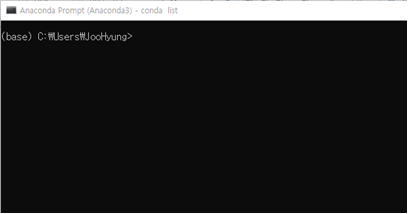
If you can confirm that the Shell has changed to (base) when executing the Prompt as shown in the figure below, Anaconda has been installed successfully.
(Figure 4-2-9) Anaconda Command Window Check
C. Creating and Configuring Anaconda Virtual Environment
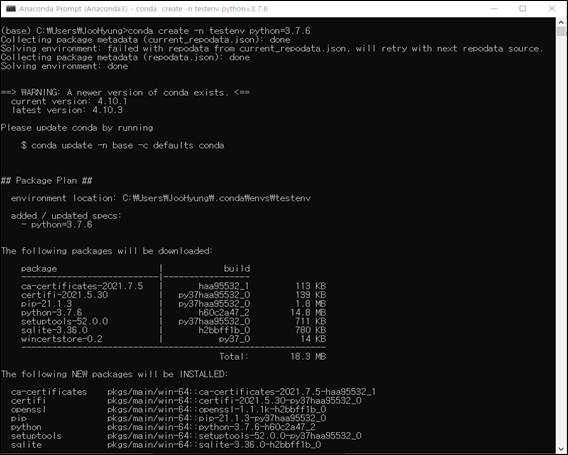
conda create -n testenv python=3.7.6
Execute the command above in the Anaconda Prompt. The command below creates a virtual environment named testenv and sets the Python version to be used in that virtual environment to 3.7.6. (Internet connection required) When executed, the necessary packages will be automatically downloaded and installed in the virtual environment, as shown in the figure below.
(Figure 4-2-10) testenv Virtual Environment Installation Screen
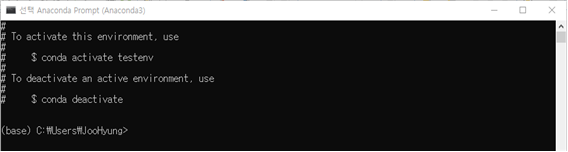
After the virtual environment configuration is automatically completed, a completion screen is displayed as shown in the figure below.
(Figure 4-2-11) testenv Virtual Environment Installation Completion Screen
Enter the following command in the Anaconda Prompt.
conda activate testenv
The above command activates the virtual environment named testenv in Anaconda. After executing the command, the beginning of the Shell Prompt changes to the virtual environment named testenv as shown below.
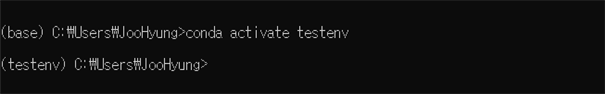
(Figure 4-2-12) Activating testenv Virtual Environment
D. Anaconda Command Summary
                                    Python Conda Command Summary

                                    Conda Repo Site : https://repo.anaconda.com/archive/


                                    conda env list

                                    - Check Conda virtual environment list


                                    conda create -n test python=3

                                    - Create Anaconda virtual environment, use Python version 3, create a virtual
                                    environment named test


                                    conda activate test

                                    - Activate Conda virtual environment (Check Shell Prompt change)


                                    conda deactivate

                                    - Deactivate virtual environment (Check Shell Prompt change)


                                    conda install tensorflow-gpu

                                    - Install conda package, execute while virtual environment is active


                                    conda env remove -n test

                                    - Remove virtual environment


                                    conda create --clone test -n test1

                                    - Clone virtual environment

                                    conda create --clone [source_env_name] -n [new_env_name]


                                    conda --version

                                    - Check installed Anaconda version


                                    conda info

                                    - View information about installed Anaconda


                                    conda list

                                    - View list of packages installed in the virtual environment


                                    conda install -n test1 tensorflow

                                    - conda install -n env_name package_name, Install package in a different virtual
                                    environment than the currently active one


                                    conda update tensorflow

                                    - Update installed package, conda update package_name


                                    conda remove -n test tensorflow

                                    - Remove installed package

                                    conda remove -n env_name package_name
E. miniconda
Anaconda includes vast scientific packages and applications like Spyder and Jupyter Notebook, so it takes up a lot of disk space. For users who do not need these other applications or an excessive number of packages, there is miniconda, which allows building only a minimal environment.
miniconda is a minimal free installer for conda and a small bootstrap version of Anaconda that includes Conda, Python, and key packages (including dependency packages). Also, you can install over 720 additional Conda packages from the Anaconda repository using the conda install command.
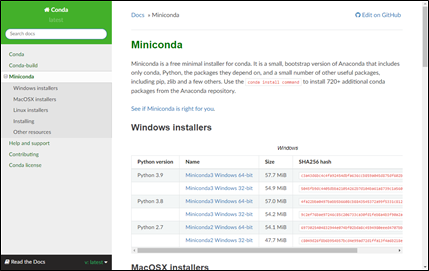
(Figure 4-2-13) miniconda Download Page
Users who are familiar with CLI (Command Line Interface) but are concerned about excessive disk space or resource waste can use miniconda instead of Anaconda, so please refer to the following link to use it. (Installation and usage methods are the same as Anaconda)
Download Homepage Link : https://docs.conda.io/en/latest/miniconda.html
IV. Appendix
Spyder (Python IDE)
Spyder (Scientific PYthon Development EnviRonment) is an open source cross-platform integrated development environment for scientific programming in Python language. Spyder provides functions as an IDE that is convenient for writing Python files, executing them file by file, and checking the state of variables in memory.
Since Spyder is included in the Anaconda package, please refer to the Anaconda Installation for the download and installation process.
A. Using CLIK API Client with Spyder
Assuming that the API Key setting is completed in the CLIK API of this document, we will explain the process of downloading MME data using Spyder.
Enter the Key issued from the CLIK website into the apccapi.properties file as shown below and save it. There is no separately provided apccapi.properties file, so write it directly as shown below or create a file with the following content by referring to the CLIK website. The file name is apccapi and the extension is properties.
                                        key=810050f2-727e-5ed3-a871-b7a881a04d34

                                        request_url=https://www.apcc21.org/clik/clikapi/request/apccdata

                                        status_url=https://www.apcc21.org/clik/clikapi/request/status
[Code A1] apccapi.properties
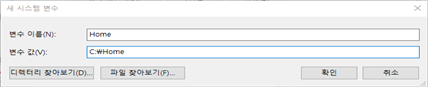
Copy the apccapi.properties file to a suitable location. In this document, it is set to C:\Home\. Please remember the file copy location.
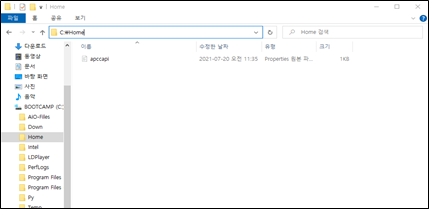
(Figure 4-3-1) apccapi.properties Copy Path
Open Windows Settings and select the System menu.
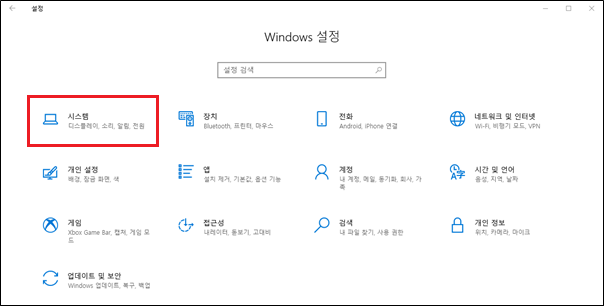
(Figure 4-3-2) Windows Settings - System
Select 'About' from the left menu, then select 'Advanced system settings' from the related settings on the page that appears.
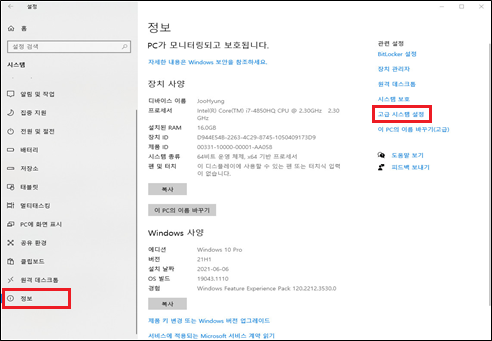
(Figure 4-3-3) About - Advanced System Settings
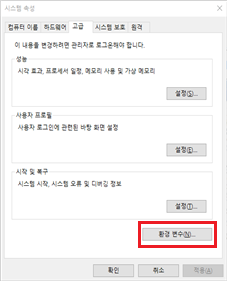
When the System Properties popup box appears, select 'Environment Variables (N)' at the bottom of the Advanced tab to enter environment variable editing.
(Figure 4-3-4) System Properties ??Environment Variables (N)
(Figure 4-3-5) System Properties ??Environment Variables Screen
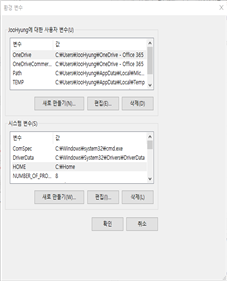
Create a new system variable 'Home' as shown in the figure below and specify the path where the apccapi.properties file is located.
(Figure 4-3-6) New System Variable
Run the Spyder program installed with Anaconda.
(Figure 4-3-7) Anaconda Collection ??Running Spyder
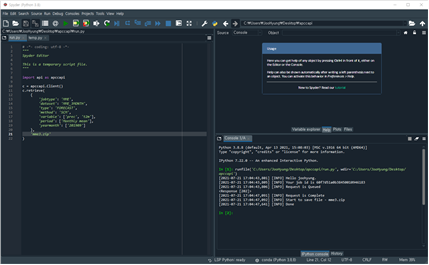
Download the API Client provided on the CLIK homepage and unzip it to a suitable location. You can call the API to request data with a simple Python program. The source code example below shows writing and executing run.py using Spyder. (The run.py source code must be located in the same directory as the CLIK API Client program (api.py).)
                                        import api as apccapi


                                        c = apccapi.Client()

                                        c.retrieve(

                                        {

                                           'jobtype': 'MME',

                                           'dataset': 'MME_3MONTH',

                                           'type': 'FORECAST',

                                           'method': 'SCM',

                                           'variable': ['prec', 't2m'],

                                           'period': ['Monthly mean'],

                                           'yearmonth': ['201909', '201910']

                                        },

                                           'mme3.zip'

                                        )
[Code A2] run.py
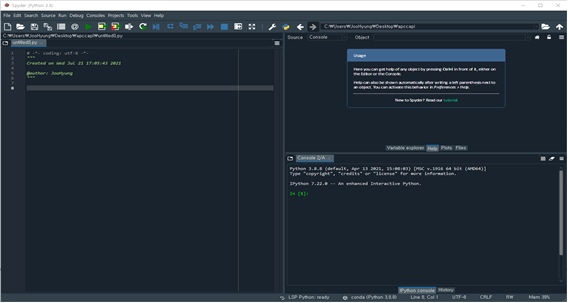
Execute the written run.py file (F5).
(Figure 4-3-8) Running run.py
When run.py is executed normally, the result appears in the IPython console as shown in the figure below. After the code is executed, if you check the folder where run.py is located, you can confirm that the mme3.zip file has been created.
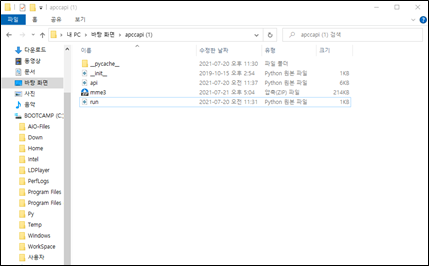
(Figure 4-3-9) run.py Execution Result
IV. Appendix
Panoply Data Viewer
A. Panoply Data Viewer Download
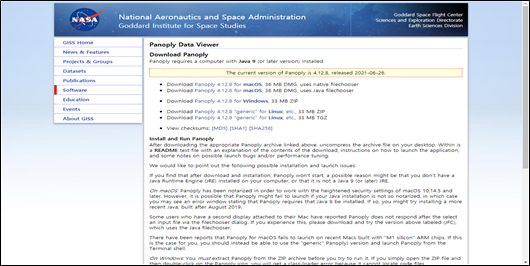
NASA provides Panoply Data Viewer to check NetCDF (.nc) files. Go to https://www.giss.nasa.gov/tools/panoply/ and navigate to the download page via the Get Panoply ??Download Panoply link at the bottom of the screen.
(Figure 4-4-1) Panoply Download Homepage
Download the Panoply Data Viewer suitable for your operating system from the page.
B. Panoply Data Viewer Installation
Panoply Data Viewer can be executed by unzipping it without a separate installation process. You can run Panoply Data Viewer by executing the Panoply.exe file in the unzipped folder.
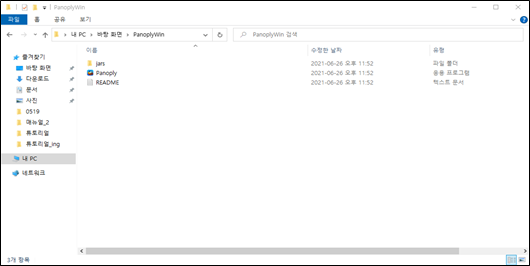
(Figure 4-4-2) Panoply Unzip Result
However, since Panoply Data Viewer was developed based on Java, installation of Java Runtime Environment 9.0 or higher is required. If Java Runtime Environment is not installed, go to the link below to install Java Runtime Environment first, then restart Panoply Data Viewer.
Java Runtime Environment Download Link :
https://www.oracle.com/kr/java/technologies/javase/javase9-archive-downloads.html
C. Running Panoply Data Viewer
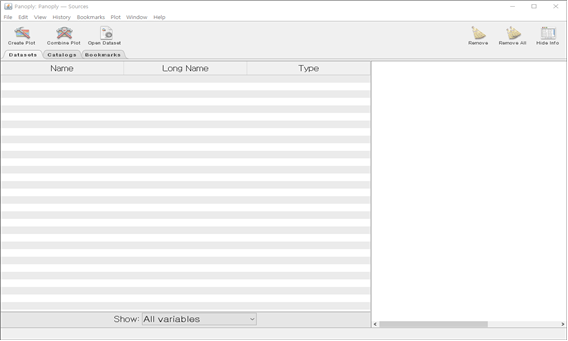
If you have downloaded Panoply Data Viewer normally (and Java Runtime Environment 9.0 or higher is installed), executing the Panoply.exe file will run Panoply Data Viewer as shown in the figure below.
(Figure 4-4-3) Panoply Execution Screen
Select File menu - Open in the top left corner and select the downloaded nc file to check the information about the .nc file as shown in the figure below.
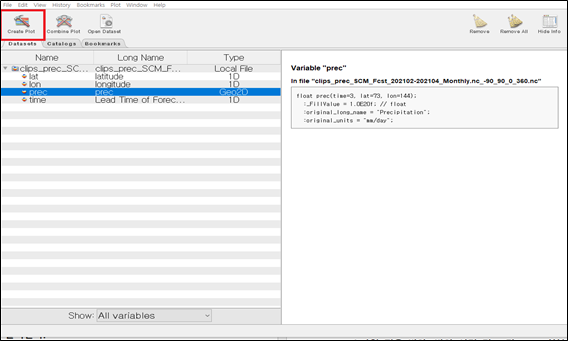
(Figure 4-4-4) Running Create Plot
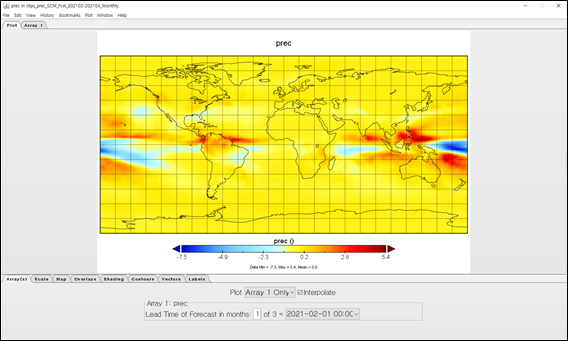
After selecting the variable value you want to display as shown in the figure above (prec in the screen above), click the Create Plot button in the top left to plot the content of the .nc file on the screen as shown in the figure below.
(Figure 4-4-5) Create Plot Execution Result Screen